GBP/USD 5-Minute Analysis
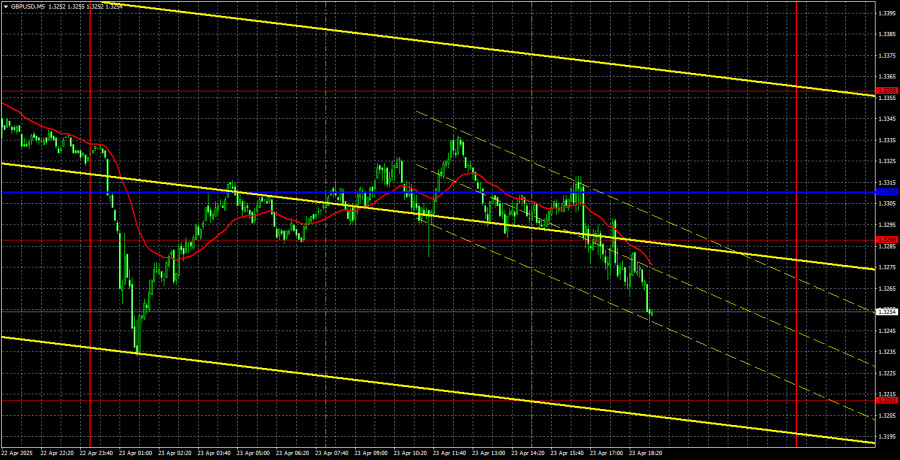
On Wednesday, the GBP/USD currency pair followed the same trend as the EUR/USD pair. The British pound also plummeted sharply overnight following two statements from Donald Trump, then quickly recovered, only to fall again. It's worth noting that in the first half of the day, the pound predominantly rose despite UK macroeconomic data on business activity being difficult to classify as "positive." The U.S. dollar strengthened in the second half of the day, although U.S. business activity data could also hardly be considered strong. Thus, we continue to believe that there is no apparent logic in the market movements.
What triggered the overnight market reaction? Was it Trump's refusal to fire Powell? The U.S. President has neither the right nor the power to dismiss the Federal Reserve Chair. Was it his statement that tariffs on China would be lower than 145%? Would it make a big difference if they were 50%? Both China and the U.S. need a trade deal, but no negotiations are currently taking place—or at least there is no public information to suggest otherwise. Therefore, discussing de-escalation (which would support the dollar) is premature. So, what exactly excited the market? More Trump statements that he might contradict or reinterpret tomorrow?
We didn't even bother marking trading signals on the 5-minute timeframe again. Throughout the day, both the 1.3288 level and the Kijun-sen line were ignored more often than not. The price bounced off the 1.3288 level three times, but the critical line was crossed upward and downward at least eight times. Therefore, traders should keep in mind that movements remain highly random, and the overall behavior of the market is erratic.
COT Report
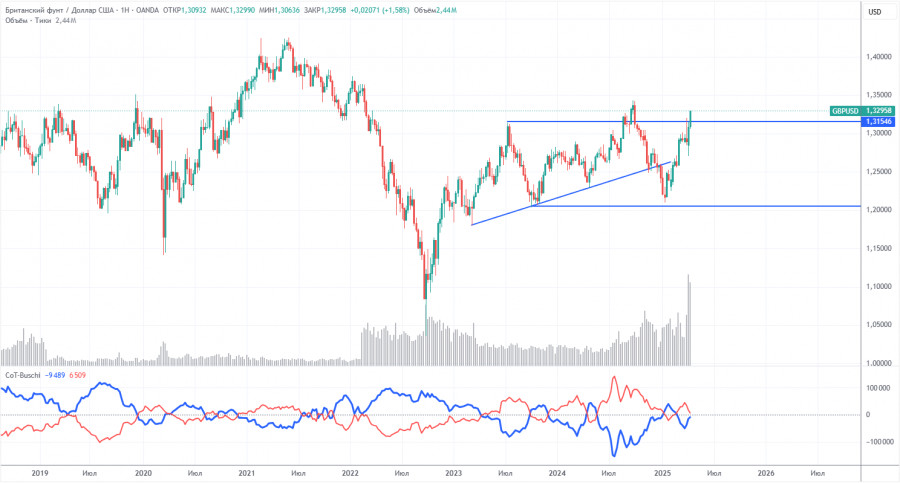
COT (Commitments of Traders) reports on the British pound show that sentiment among commercial traders has been constantly shifting over recent years. The red and blue lines, representing net positions of commercial and non-commercial traders, frequently intersect and are usually close to the zero mark. This is still the case now, which indicates a roughly equal number of long and short positions.
On the weekly timeframe, the price first broke through the 1.3154 level, then overcame the trendline, returned to 1.3154, and broke it again. The breach of the trendline would typically suggest a high likelihood of further pound declines. However, we continue to see the dollar falling due to Donald Trump. Therefore, trade war news may keep pushing the pound even higher, regardless of the technical picture.
According to the latest COT report on the British pound, the "Non-commercial" group closed 6,000 BUY contracts and opened 4,700 SELL contracts. As a result, the net position of non-commercial traders has declined for the third consecutive week (-10,700 contracts), yet this hasn't had any meaningful impact on price movement.
The fundamental background still doesn't support long-term buying of the British pound, and the currency has realistic chances of continuing its long-term downtrend. The pound has risen sharply in recent months, but the reason is apparent: Trump's policy actions.
GBP/USD 1-Hour Analysis
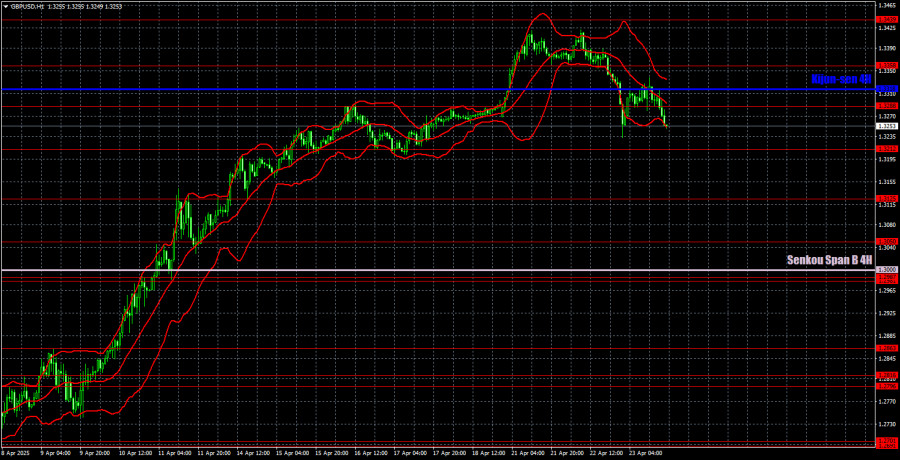
On the hourly timeframe, GBP/USD showed a strong surge after almost a month of flat movement, followed by an even more substantial drop and another powerful surge. A correction has now begun. The pound has posted significant gains in recent months, though it had little to do with its merit. The upward movement of the pound is a result of the dollar's decline, which Donald Trump triggered. And that decline is not yet over. Thus, confusion, chaos, and panic continue to reign in the market, with little logic or consistency in price movements.
For April 24, we highlight the following key levels: 1.2691–1.2701, 1.2796–1.2816, 1.2863, 1.2981–1.2987, 1.3050, 1.3125, 1.3212, 1.3288, 1.3358, 1.3439, 1.3489, 1.3537. The Senkou Span B line (1.3000) and the Kijun-sen line (1.3318) can also act as signal sources. Setting a Stop Loss at breakeven is recommended once the price moves 20 pips in the correct direction. Ichimoku indicator lines may shift during the day and should be considered when determining trading signals.
No major events are scheduled for Thursday in the UK. In the U.S., reports on new home sales and durable goods orders are expected. However, the first three days of the week have shown that significant moves can occur even in the absence of noteworthy news, and macroeconomic data continues to be absorbed by the market in total disarray. Therefore, we may be in for more chaotic movements today.
Illustration Explanations:
- Support and Resistance Levels (thick red lines): Thick red lines indicate where movement may come to an end. Please note that these lines are not sources of trading signals.
- Kijun-sen and Senkou Span B Lines: Ichimoku indicator lines transferred from the 4-hour timeframe to the hourly timeframe. These are strong lines.
- Extreme Levels (thin red lines): Thin red lines where the price has previously bounced. These serve as sources of trading signals.
- Yellow Lines: Trendlines, trend channels, or any other technical patterns.
- Indicator 1 on COT Charts: Represents the net position size for each category of traders.


