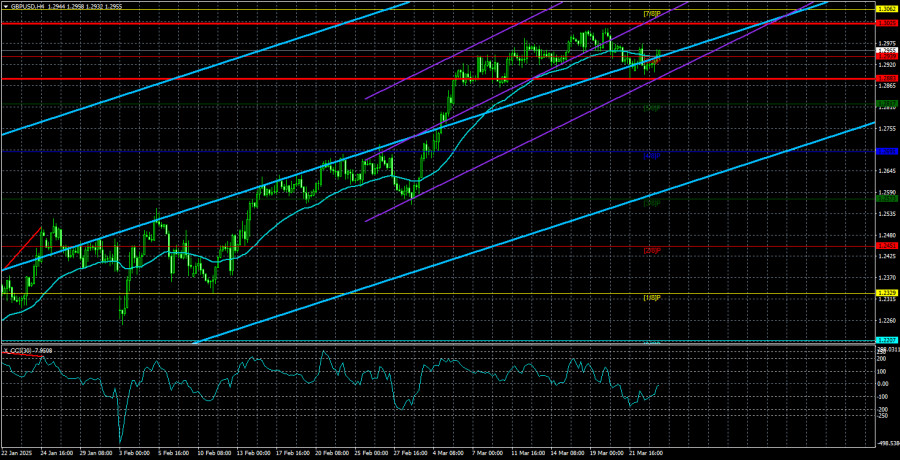
The GBP/USD currency pair resumed its upward movement on Tuesday. It did so on a day when there were no significant events in the UK, and the only noteworthy report from the U.S. was the new home sales data. The pair resumed its rise without even a correction. Do we need to say more? The British currency is climbing again, and it's doing so for the same reason it has been in recent weeks. We wouldn't even call this reason "Donald Trump's trade policy"—it's just "Donald Trump."
In our view, many American consumers, investors, traders, businesspeople, actors, and directors no longer support the U.S. trade policy and the White House's foreign and domestic policies. Trump's decisions often appear absurd. Many also struggle to understand his military-political choices—such as the effective abandonment of Ukraine and NATO.
People can have different views on the Russia–Ukraine conflict, but the U.S. supported Ukraine for four years. Then Trump came along, and America essentially walked away from that commitment. A logical question arises for American voters: why spend four years and billions of dollars supporting Kyiv only to abandon it? Another question: if a Democratic president is elected in four years, will the U.S. go back to arming and funding Ukraine?
This paints a picture of no consistent U.S. foreign policy. A Republican president supports Russia, opposes China, and ignores Ukraine. A Democratic president opposes Russia, remains neutral toward China, and supports Ukraine. It's also starting to feel like Congress has been on vacation for the past two months—Trump seems to be making decisions unilaterally.
This is precisely what many investors and business leaders find unacceptable. Trump may sound great at rallies, promising Americans the moon, but in practice, stock markets are falling, American goods are being boycotted globally, and the U.S. is damaging its relationships with neighbors like Canada and Mexico and key trade partners like China and the EU. What is it all for?
Since the answer is unclear, the market is erring on the side of caution—ditching U.S. equities, exiting American businesses, and selling the dollar, assuming it can always buy it back later. So even if only one factor weighs on the dollar, the greenback could continue depreciating. At this point, traders must understand why the dollar is falling and realize that nearly all other factors are being ignored.
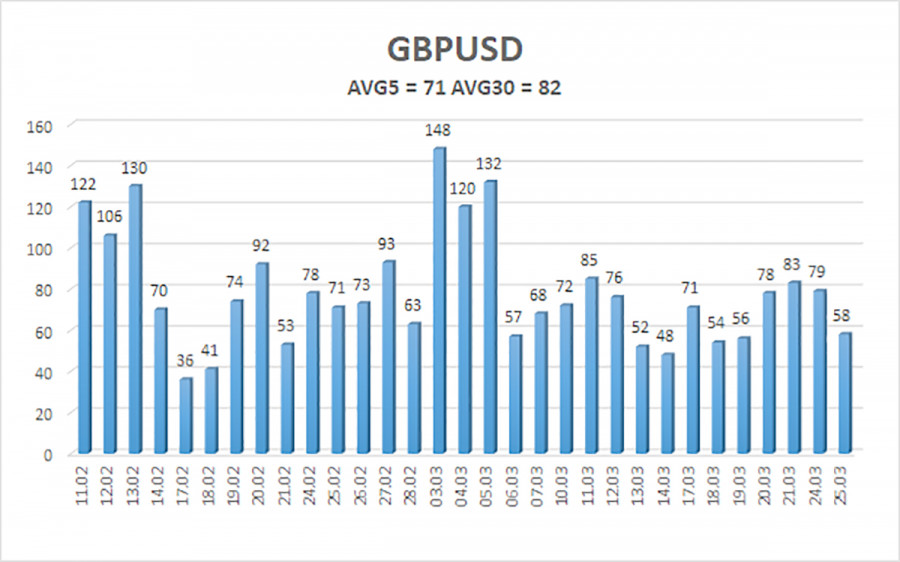
The average volatility of the GBP/USD pair over the last five trading days is 71 pips, which is considered "moderate-low" for this currency pair. On Wednesday, March 26, we expect movement within the range of 1.2883 to 1.3025. The long-term regression channel has turned upward, but the downtrend remains intact on the daily timeframe. The CCI indicator has not recently entered overbought or oversold territory.
Nearest Support Levels:
S1 – 1.2817
S2 – 1.2695
S3 – 1.2573
Nearest Resistance Levels:
R1 – 1.2939
R2 – 1.3062
R3 – 1.3184
Trading Recommendations:
The GBP/USD pair maintains a medium-term downtrend, while a very weak correction has begun in the 4-hour timeframe. This correction could end as the market continues to shun the dollar. We still do not consider long positions, as the current upward movement appears to be a daily timeframe correction that has taken on an illogical, panic-like character. However, if you're trading purely on technicals, longs remain relevant with targets at 1.3025 and 1.3062 as long as the price holds above the moving average. Short positions remain attractive with targets at 1.2207 and 1.2146 because the daily timeframe correction will end sooner or later—unless the previous downtrend ends first. The pound looks extremely overbought and unjustifiably expensive, and Donald Trump won't be able to devalue the dollar indefinitely. It is difficult to predict how long the dollar collapse driven by Trump will last.
Explanation of Illustrations:
Linear Regression Channels help determine the current trend. If both channels are aligned, it indicates a strong trend.
Moving Average Line (settings: 20,0, smoothed) defines the short-term trend and guides the trading direction.
Murray Levels act as target levels for movements and corrections.
Volatility Levels (red lines) represent the likely price range for the pair over the next 24 hours based on current volatility readings.
CCI Indicator: If it enters the oversold region (below -250) or overbought region (above +250), it signals an impending trend reversal in the opposite direction.


