In my morning forecast, I focused on the 1.3066 level and planned to make market entry decisions based on it. Let us look at the 5-minute chart and analyze what happened. The decline and the formation of a false breakout at this level provided a sufficient condition for opening long positions, resulting in a slight rise of the pair by 30 points. The technical outlook for the second half of the day has not been revised.
To open long positions on GBP/USD:
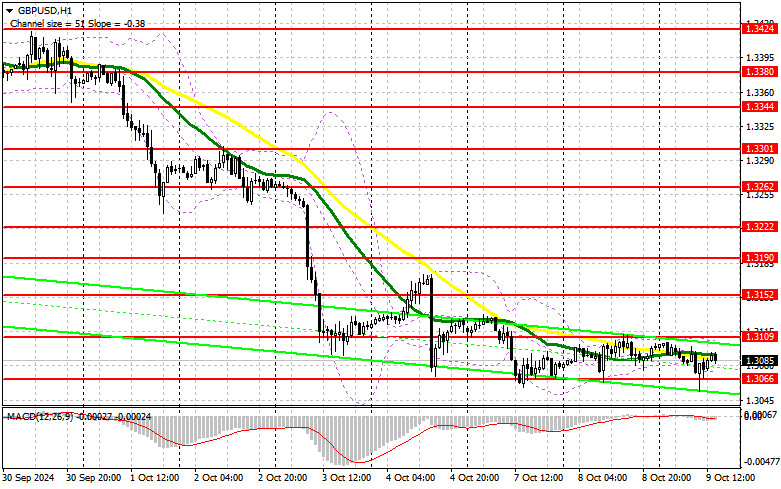
It is clear that the lack of data is impacting the pound, allowing bears to repeatedly push for new weekly lows, maintaining the downward trend. This afternoon, a series of interviews with FOMC representatives and the release of the September monetary policy meeting minutes is expected. All of this is likely to favor the dollar, potentially leading to a further decline in the pair, which I plan to take advantage of. A false breakout around 1.3066, similar to the one analyzed earlier, will provide a chance for the pair to recover to the 1.3109 level, where the moving averages, which favor sellers, are located. A breakout and a retest from above of this range will increase the chances of a bullish trend, leading to the triggering of sellers' stop orders and a good entry point for long positions, aiming for the 1.3152 level. The ultimate target would be the 1.3190 level, where I plan to take profit. If GBP/USD declines and bulls show no activity around 1.3066 in the second half of the day, as this level has already been tested once today, pressure on the pair will increase. This could lead to further declines and a retest of the 1.3033 support. Only a false breakout would be a suitable condition for opening long positions. I plan to buy GBP/USD immediately on a rebound from the 1.3003 low, targeting a 30-35 point correction within the day.
To open short positions on GBP/USD:
Sellers are making their presence known. If the pair rises after FOMC members' comments to the resistance area at 1.3109, a false breakout there will provide a suitable opportunity for opening short positions, targeting a drop to the 1.3066 support. A breakout and a bottom-up retest of this range would only be possible if the FOMC members hint at a less aggressive rate cut. This would also undermine the buyers' positions, triggering stop orders and opening the way to 1.3033. The ultimate target would be the 1.3003 level, where I plan to take profit. A successful test of this level would strengthen the bearish market. If GBP/USD rises and there is no bearish activity at 1.3109 in the second half of the day, buyers might attempt to regain some losses. Bears would have no choice but to retreat to the 1.3152 resistance area, which could become the upper boundary of a sideways channel. I will only sell there after a false breakout. If there is no downward movement even there, I will look for short positions on a rebound around 1.3190, aiming for a 30-35 point downward correction within the day.
The COT (Commitment of Traders) report for October 1 showed an increase in long positions and a minimal reduction in short ones. Clearly, the incoming statistics from the UK have recently created additional obstacles for further pound purchases, but no one is seriously considering selling yet, given the current indicators. However, it is important to understand that this report does not take into account recent changes in the market from late last week after the release of strong labor market data. Therefore, paying special attention to it is not particularly useful. The latest COT report indicates that long non-commercial positions increased by 6,144 to 161,469, while short non-commercial positions decreased by 629 to 67,704. As a result, the gap between long and short positions decreased by 100.
Indicator signals:
Moving averages:
Trading is conducted around the 30-day and 50-day moving averages, indicating a sideways market.
Note: The period and prices of the moving averages are considered by the author on the hourly H1 chart and differ from the general definition of classical daily moving averages on the D1 chart.
Bollinger Bands:
In case of a decline, the lower boundary of the indicator around 1.3066 will act as support.
Indicator descriptions:
- Moving average: Determines the current trend by smoothing out volatility and noise. Period 50. Marked in yellow on the chart.
- Moving average: Determines the current trend by smoothing out volatility and noise. Period 30. Marked in green on the chart.
- MACD (Moving Average Convergence/Divergence): Fast EMA with a period of 12, Slow EMA with a period of 26, and SMA with a period of 9.
- Bollinger Bands: Period 20.
- Non-commercial traders: Individual traders, hedge funds, and large institutions using the futures market for speculative purposes and meeting certain criteria.
- Long non-commercial positions represent the total long open position of non-commercial traders.
- Short non-commercial positions represent the total short open position of non-commercial traders.
- Total non-commercial net position is the difference between short and long positions of non-commercial traders.