empty
21.06.2023 11:20 AM
EUR/USD and GBP/USD: Trading plan for beginners on June 21, 2023

Details of the economic calendar on June 20

Yesterday, the U.S. Census Bureau published the report for May, which noted that the volume of new home construction increased by 21.7% compared to the previous month. This growth occurred after a decrease of 2.9% (revised from +2.2%) in April. This figure significantly exceeded market expectations, which predicted a decline of 0.8%.

The report also indicates that the number of building permits issued in May increased by 5.2% compared to analysts' forecasts, which anticipated a decrease of 5%.

The market instantly reacted to these statistical data, strengthening dollar positions.

Analysis of trading charts from June 20

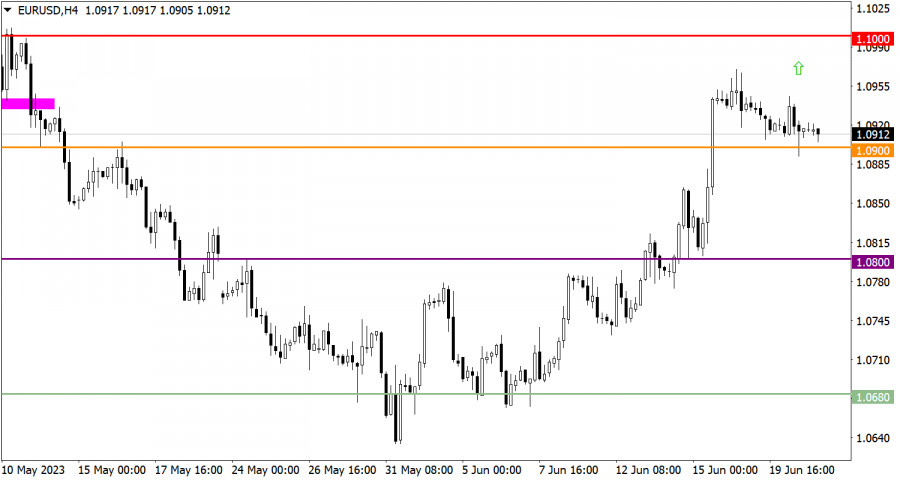
The EUR/USD currency pair recovered after a price pullback and returned to the area of 1.0900, where a consolidation formed. There are no sharp changes on the chart, and the overall trend remains upward, despite the pullback cycle.

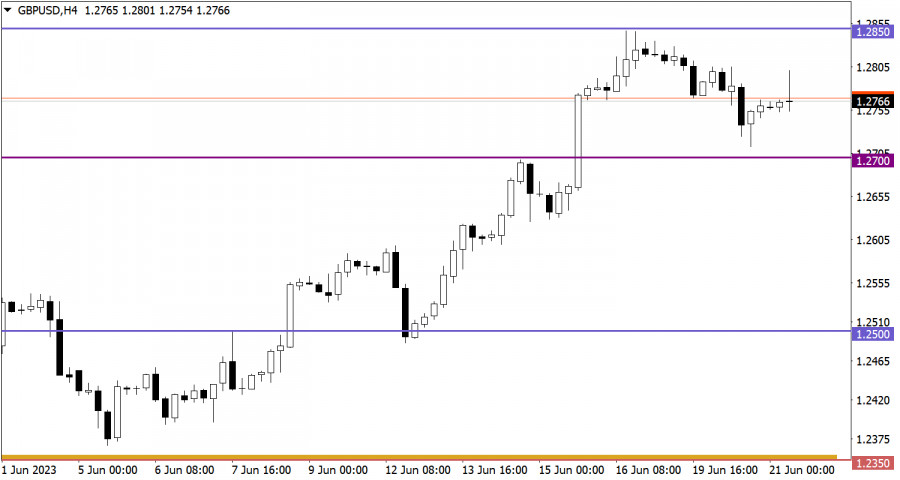
The GBP/USD pair pulled back from the local high of the medium-term trend and almost reached 1.2700, where a reduction in short positions occurred.

This image is no longer relevant

Economic calendar for June 21

At the beginning of the European session, inflation data for the UK was published, which stood at 8.7% on an annual basis in May. This value remained at the previous month's level, while analytical agencies forecasted a slowdown in price growth to 8.4%.

Considering this data, there is confidence that the Bank of England will raise its key interest rate tomorrow. Based on this information, the value of the British pound began to rise.

EUR/USD trading plan for June 21

The further upward movement of the euro is expected to occur when the price returns above the 1.0950 level. In this case, there is a possibility of prolonging the euro's course to the upper area of the psychological level 1.1000/1.1050. However, to allow for a downward scenario and subsequent formation of a pullback, it is necessary to keep the price below the 1.0900 level.

This image is no longer relevant

GBP/USD trading plan for June 21

For a pullback to form, the quote needs to stay below the 1.2700 level. Otherwise, there is a possibility of subsequent growth in long positions, which could lead the price to return to the 1.2850 level.

This image is no longer relevant

What's on the charts

The candlestick chart type is white and black graphic rectangles with lines above and below. With a detailed analysis of each individual candle, you can see its characteristics relative to a particular time frame: opening price, closing price, intraday high and low.

Horizontal levels are price coordinates, relative to which a price may stop or reverse its trajectory. In the market, these levels are called support and resistance.

Circles and rectangles are highlighted examples where the price reversed in history. This color highlighting indicates horizontal lines that may put pressure on the asset's price in the future.

The up/down arrows are landmarks of the possible price direction in the future.

Gven Podolsky,
Analytical expert of InstaForex
© 2007-2025
Select timeframe
5
min
15
min
30
min
1
hour
4
hours
1
day
1
week
Earn on cryptocurrency rate changes with InstaForex
Download MetaTrader 4 and open your first trade
  • Grand Choice
    Contest by
    InstaForex
    InstaForex always strives to help you
    fulfill your biggest dreams.
    JOIN CONTEST

Recommended Stories

How to Trade the GBP/USD Pair on April 21? Simple Tips and Trade Analysis for Beginners

Analysis of Friday's Trades 1H Chart of GBP/USD On Friday, the GBP/USD pair showed extremely low volatility, yet the British pound steadily crept upward even with such market conditions

Paolo Greco 05:36 2025-04-21 UTC+2

How to Trade the EUR/USD Pair on April 21? Simple Tips and Trade Analysis for Beginners

Analysis of Friday's Trades 1H Chart of EUR/USD The EUR/USD currency pair showed no movement on Friday. It was Good Friday, and Easter Sunday followed. As a result, many countries

Paolo Greco 05:36 2025-04-21 UTC+2

Trading Recommendations and Analysis for GBP/USD on April 21: The Pound Rises Even on Holidays

The GBP/USD currency pair traded higher again on Friday, albeit with minimal volatility. Despite the lack of important events in the U.S. or the U.K. that day (unlike earlier

Paolo Greco 04:01 2025-04-21 UTC+2

Trading Recommendations and Analysis for EUR/USD on April 21: Easter and Flat Market

On Friday, the EUR/USD currency pair essentially remained flat. By the end of the day, the euro had gained around 20 pips, but overall volatility was practically zero

Paolo Greco 04:01 2025-04-21 UTC+2

How to Trade the GBP/USD Pair on April 18? Simple Tips and Trade Analysis for Beginners

Analysis of Thursday's Trades 1H Chart of GBP/USD The GBP/USD pair continued to trade higher throughout Thursday. Even at its peak levels, the British pound shows no intention of correcting

Paolo Greco 06:51 2025-04-18 UTC+2

How to Trade the EUR/USD Pair on April 18? Simple Tips and Trade Analysis for Beginners

Analysis of Thursday's Trades 1H Chart of EUR/USD The EUR/USD currency pair continued trading within a sideways channel on Thursday, as shown on the hourly timeframe chart above. The current

Paolo Greco 06:51 2025-04-18 UTC+2

Trading Recommendations and Analysis for GBP/USD on April 18: The British Pound Is Losing Steam

The GBP/USD currency pair continued its upward movement on Thursday, trading near multi-year highs. Despite the lack of significant events in the U.S. or the U.K. (unlike Wednesday), the market

Paolo Greco 03:48 2025-04-18 UTC+2

Trading Recommendations and Analysis for EUR/USD on April 18: The ECB Failed to Move the Market

The EUR/USD currency pair continued to trade sideways on Thursday. While previously it had been moving within a range between 1.1274 and 1.1391, on Thursday, it was stuck

Paolo Greco 03:48 2025-04-18 UTC+2

GBP/USD: Trading Plan for the U.S. Session on April 17th (Review of Morning Trades)

In my morning forecast, I focused on the 1.3239 level and planned to base entry decisions around it. Let's look at the 5-minute chart and see what happened. A rise

Miroslaw Bawulski 18:53 2025-04-17 UTC+2

EUR/USD: Trading Plan for the U.S. Session on April 17th (Review of Morning Trades)

In my morning forecast, I highlighted the 1.1341 level and planned to base my market entry decisions on it. Let's look at the 5-minute chart and analyze what happened

Miroslaw Bawulski 18:50 2025-04-17 UTC+2
Can't speak right now?
Ask your question in the chat.
Widget callback
 

Dear visitor,

Your IP address shows that you are currently located in the USA. If you are a resident of the United States, you are prohibited from using the services of InstaFintech Group including online trading, online transfers, deposit/withdrawal of funds, etc.

If you think you are seeing this message by mistake and your location is not the US, kindly proceed to the website. Otherwise, you must leave the website in order to comply with government restrictions.

Why does your IP address show your location as the USA?

  • - you are using a VPN provided by a hosting company based in the United States;
  • - your IP does not have proper WHOIS records;
  • - an error occurred in the WHOIS geolocation database.

Please confirm whether you are a US resident or not by clicking the relevant button below. If you choose the wrong option, being a US resident, you will not be able to open an account with InstaForex anyway.

We are sorry for any inconvenience caused by this message.