empty
17.11.2022 01:34 PM
Technical analysis of EUR/USD for November 17, 2022

This image is no longer relevant

Overview :

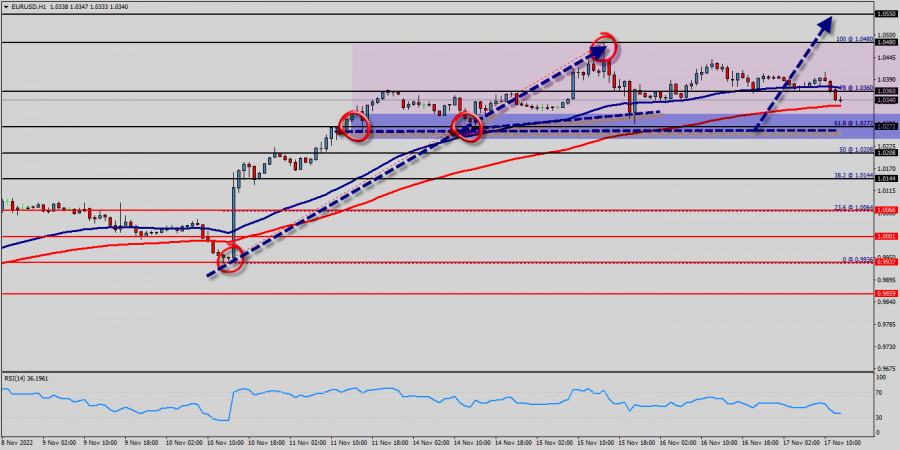
The EUR/USD pair's rise from 1.0272 is still in progress and intraday bias stays on the upside for 1.0272 resistance first on the one-hour chart. All elements being clearly bullish market, it would be possible for traders to trade only long positions on the EUR/USD pair as long as the price remains well above the price of 1.0272. The EUR/USD pair will continue rising from the level of 1.0272 in the long term. It should be noted that the support is established at the level of 1.0272 which represents the daily pivot point. The price is likely to form a double bottom in the same time frame. Accordingly, the EUR/USD pair is showing signs of strength following a breakout of the highest level of 1.0340. This suggests that the pair will probably go up in coming hours.

If the trend is able to break the level of 1.0340, then the market will call for a strong bullish market towards the objectives between 1.0272 ans 1.0480 this week. Currently, the price is in a bullish channel. This is confirmed by the RSI indicator signaling that we are still in a bullish trending market. As the price is still above the moving average (100), immediate support is seen at 1.0272, which coincides with a key ratio (61.8% of Fibonacci). The EUR/USD pair swing around the breached resistance of the bullish channel and keeps its stability above it until now, noticing that the EMA50 continues to resistance the price from above, while RSI begins to overlap positively.

Thus, the market is indicating a bullish opportunity above the above-mentioned support levels, for that the bullish outlook remains the same as long as the 100 EMA is headed to the upside. So, buy above the level of 1.0340 with the first target at 1.0360 in order to test the daily resistance 1. The buyers' bullish objective is set at the level of 1.0480. A bullish break in this resistance would boost the bullish momentum. The buyers could then target the resistance located at 1.0480. If there is any crossing, the next objective would be the resistance located at 1.0480. The level of 1.0550 is a good place to take profits.

Moreover, the RSI is still signaling that the trend is upward as it remains strong above the moving average (100). However, beware of bullish excesses that could lead to a possible short-term correction; but this possible correction would not be tradeable.

On the other hand, in case a reversal takes place and the EUR/USD pair breaks through the support level of 1.0272, a further decline to 1.0208 and 1.0144 can occur. It would indicate a bearish market.

Select timeframe
5
min
15
min
30
min
1
hour
4
hours
1
day
1
week
Earn on cryptocurrency rate changes with InstaForex
Download MetaTrader 4 and open your first trade
  • Grand Choice
    Contest by
    InstaForex
    InstaForex always strives to help you
    fulfill your biggest dreams.
    JOIN CONTEST

Recommended Stories

Trading Signals for EUR/USD for May 14-19, 2025: sell below 1.1230 (200 EMA - 21 SMA)

The euro is expected to continue its fall in the coming hours. Therefore, we should expect a close below 1.1186 on the H4 chart. Then, the price could slide

Dimitrios Zappas 18:06 2025-05-14 UTC+2

Trading Signals for GOLD for May 14-19, 2025: buy above $3,175 (200 EMA - rebound)

Gold left a gap around 3,325. It is likely to be filled in the coming days. For this, we should wait for gold to consolidate above 3,230, then the outlook

Dimitrios Zappas 18:05 2025-05-14 UTC+2

WTI - West Texas Intermediate. Analysis and Forecast

Prices for U.S. crude oil West Texas Intermediate (WTI) are consolidating near a one-month high, pausing a four-day winning streak, although the intraday pullback lacks bearish conviction. WTI prices

Irina Yanina 17:55 2025-05-14 UTC+2

EUR/USD Analysis on May 14, 2025

On Tuesday, the EUR/USD pair rebounded from the support zone of 1.1074–1.1081 and reversed in favor of the euro, climbing by 110 points. Thus, the bears' joy was short-lived

Samir Klishi 11:20 2025-05-14 UTC+2

GBP/USD Analysis on May 14, 2025

On the hourly chart, the GBP/USD pair continued its upward movement on Tuesday after bouncing off the 1.3139 level. Judging by the wave structure, the bearish trend has not been

Samir Klishi 11:17 2025-05-14 UTC+2

Forex forecast 14/05/2025: EUR/USD, GBP/USD, Oil, Ethereum and Bitcoin

Useful links: My other articles are available in this section InstaForex course for beginners Popular Analytics Open trading account Important: The begginers in forex trading need to be very careful

Sebastian Seliga 10:01 2025-05-14 UTC+2

Technical Analysis of Intraday Price Movement of AUD/JPY Cross Currency Pairs, Wednesday May 14, 2025.

Although on the 4-hour chart the AUD/JPY cross currency pair is still moving above the WMA (30 Shift 2) which also has a slope that is going upwards, but because

Arief Makmur 07:42 2025-05-14 UTC+2

Technical Analysis of Daily Price Movement Crude Oil Commodity Instrument, Wednesday May 14, 2025.

From what is seen on the 4-hour chart of the Crude Oil commodity instrument, there are several interesting facts, first the appearance of a Double Bottom pattern followed by Convergence

Arief Makmur 07:42 2025-05-14 UTC+2

EUR/USD Forecast for May 14, 2025

On Tuesday, the euro chose not to continue resisting market sentiment and joined the broader risk-on trend. The U.S. stock index S&P 500 rose by 0.72%, the dollar index declined

Laurie Bailey 05:03 2025-05-14 UTC+2

GBP/USD Forecast for May 14, 2025

Amid yesterday's surge in risk appetite and general market optimism (S&P 500 +0.72%, WTI +2.78%, Dollar Index -0.76%), the British pound did not attempt to test the target support

Laurie Bailey 05:03 2025-05-14 UTC+2
Can't speak right now?
Ask your question in the chat.
Widget callback
 

Dear visitor,

Your IP address shows that you are currently located in the USA. If you are a resident of the United States, you are prohibited from using the services of InstaFintech Group including online trading, online transfers, deposit/withdrawal of funds, etc.

If you think you are seeing this message by mistake and your location is not the US, kindly proceed to the website. Otherwise, you must leave the website in order to comply with government restrictions.

Why does your IP address show your location as the USA?

  • - you are using a VPN provided by a hosting company based in the United States;
  • - your IP does not have proper WHOIS records;
  • - an error occurred in the WHOIS geolocation database.

Please confirm whether you are a US resident or not by clicking the relevant button below. If you choose the wrong option, being a US resident, you will not be able to open an account with InstaForex anyway.

We are sorry for any inconvenience caused by this message.