


signal strength 1 of 5
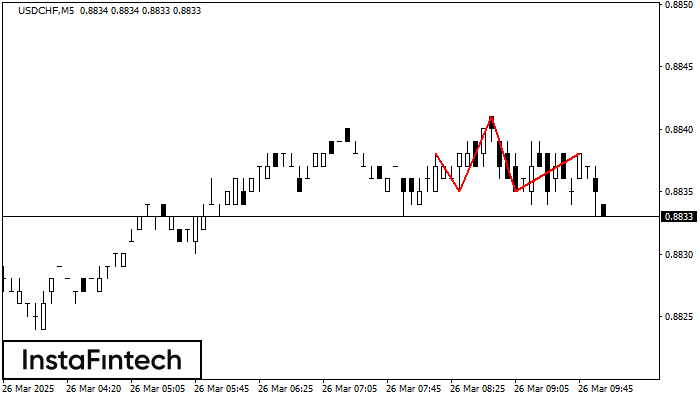
According to the chart of M5, USDCHF formed the Head and Shoulders pattern. The Head’s top is set at 0.8841 while the median line of the Neck is found at 0.8835/0.8835. The formation of the Head and Shoulders pattern evidently signals a reversal of the upward trend. In other words, in case the scenario comes true, the price of USDCHF will go towards 0.8820.
The M5 and M15 time frames may have more false entry points.
- All
- Double Top
- Flag
- Head and Shoulders
- Pennant
- Rectangle
- Triangle
- Triple top
- All
- #AAPL
- #AMZN
- #Bitcoin
- #EBAY
- #FB
- #GOOG
- #INTC
- #KO
- #MA
- #MCD
- #MSFT
- #NTDOY
- #PEP
- #TSLA
- #TWTR
- AUDCAD
- AUDCHF
- AUDJPY
- AUDUSD
- EURCAD
- EURCHF
- EURGBP
- EURJPY
- EURNZD
- EURRUB
- EURUSD
- GBPAUD
- GBPCHF
- GBPJPY
- GBPUSD
- GOLD
- NZDCAD
- NZDCHF
- NZDJPY
- NZDUSD
- SILVER
- USDCAD
- USDCHF
- USDJPY
- USDRUB
- All
- M5
- M15
- M30
- H1
- D1
- All
- Buy
- Sale
- All
- 1
- 2
- 3
- 4
- 5
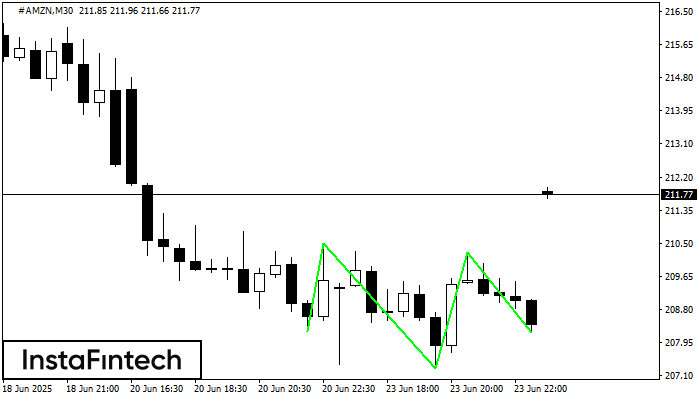
Формирование разворотной графической фигуры «Перевернутая голова и плечи» по торговому инструменту #AMZN на M30. Прогноз: в случае пробоя уровня шеи 210.51/210.27 вероятно движение в направлении координат 210.57
Открыть график инструмента в новом окне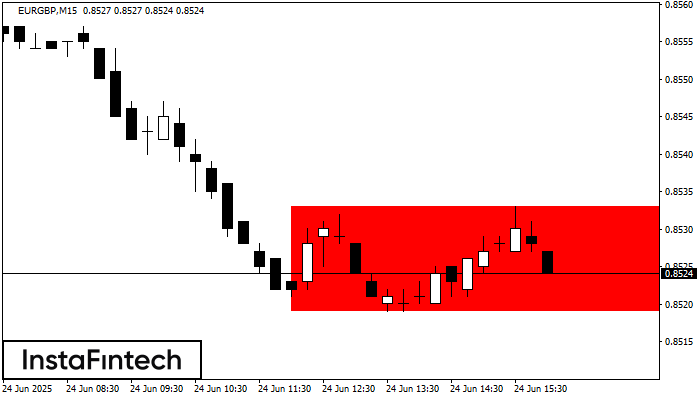
Сформирована фигура «Прямоугольник» на графике EURGBP M15. Тип фигуры: Продолжение тренда; Границы: Верхняя 0.8533, Нижняя 0.8519; Сигнал: позиция на продажу открывается после фиксации цены ниже границы прямоугольника 0.8519
Таймфреймы М5 и М15 могут иметь больше ложных точек входа.
Открыть график инструмента в новом окне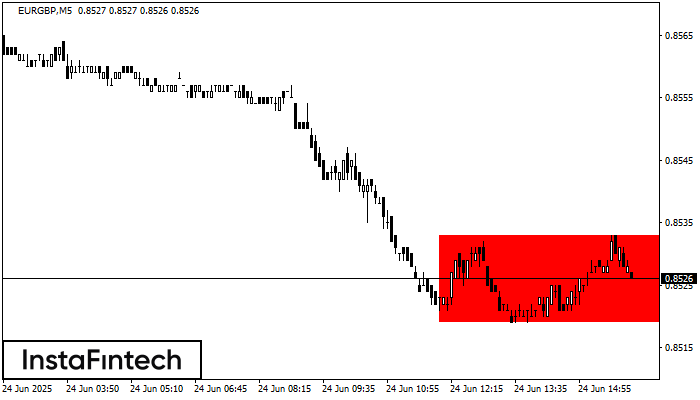
Сформирована фигура «Прямоугольник» на графике EURGBP M5. Тип фигуры: Продолжение тренда; Границы: Верхняя 0.8533, Нижняя 0.8519; Сигнал: позиция на продажу открывается после фиксации цены ниже границы прямоугольника 0.8519
Таймфреймы М5 и М15 могут иметь больше ложных точек входа.
Открыть график инструмента в новом окне


