

signal strength 1 of 5
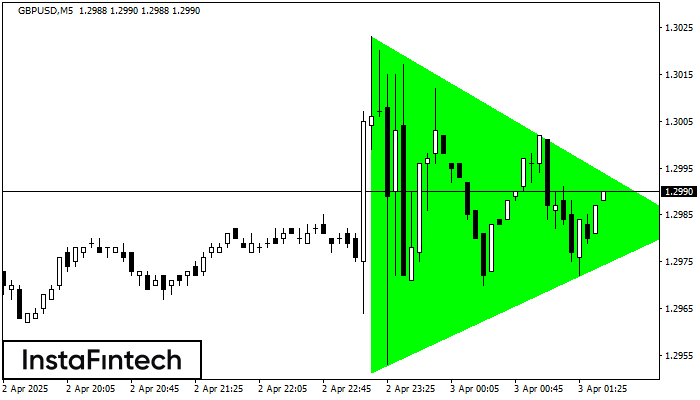
According to the chart of M5, GBPUSD formed the Bullish Symmetrical Triangle pattern. Description: This is the pattern of a trend continuation. 1.3023 and 1.2951 are the coordinates of the upper and lower borders respectively. The pattern width is measured on the chart at 72 pips. Outlook: If the upper border 1.3023 is broken, the price is likely to continue its move by 1.2998.
The M5 and M15 time frames may have more false entry points.
See Also
- All
- Double Top
- Flag
- Head and Shoulders
- Pennant
- Rectangle
- Triangle
- Triple top
- All
- #AAPL
- #AMZN
- #Bitcoin
- #EBAY
- #FB
- #GOOG
- #INTC
- #KO
- #MA
- #MCD
- #MSFT
- #NTDOY
- #PEP
- #TSLA
- #TWTR
- AUDCAD
- AUDCHF
- AUDJPY
- AUDUSD
- EURCAD
- EURCHF
- EURGBP
- EURJPY
- EURNZD
- EURRUB
- EURUSD
- GBPAUD
- GBPCHF
- GBPJPY
- GBPUSD
- GOLD
- NZDCAD
- NZDCHF
- NZDJPY
- NZDUSD
- SILVER
- USDCAD
- USDCHF
- USDJPY
- USDRUB
- All
- M5
- M15
- M30
- H1
- D1
- All
- Buy
- Sale
- All
- 1
- 2
- 3
- 4
- 5
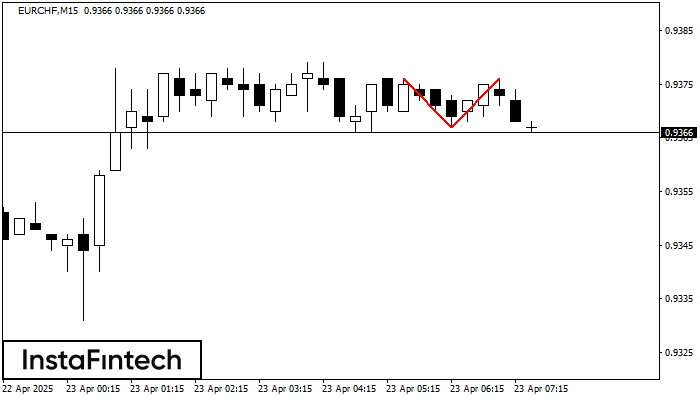
Corak pembalikan Double Top telah dibentuk pada EURCHF M15. Ciri-ciri: sempadan atas %P0.000000; sempadan bawah 0.9376; sempadan bawah 0.9367; lebar corak adalah 9 mata. Dagangan menjual adalah lebih baik untuk
Carta masa M5 dan M15 mungkin mempunyai lebih banyak titik kemasukan palsu.
Open chart in a new window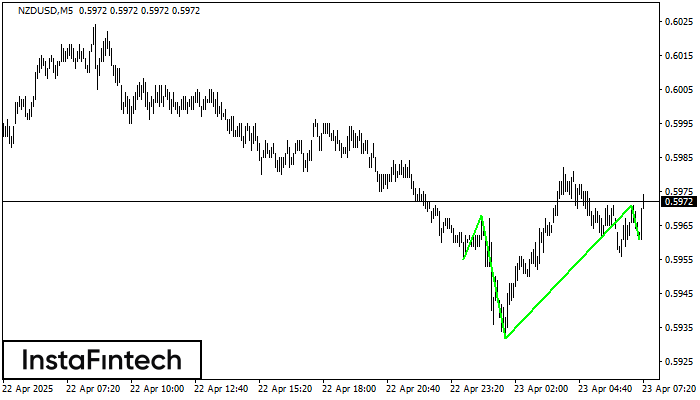
According to M5, NZDUSD is shaping the technical pattern – the Inverse Head dan Shoulder. In case the Neckline 0.5968/0.5971 is broken out, the instrument is likely to move toward
Carta masa M5 dan M15 mungkin mempunyai lebih banyak titik kemasukan palsu.
Open chart in a new window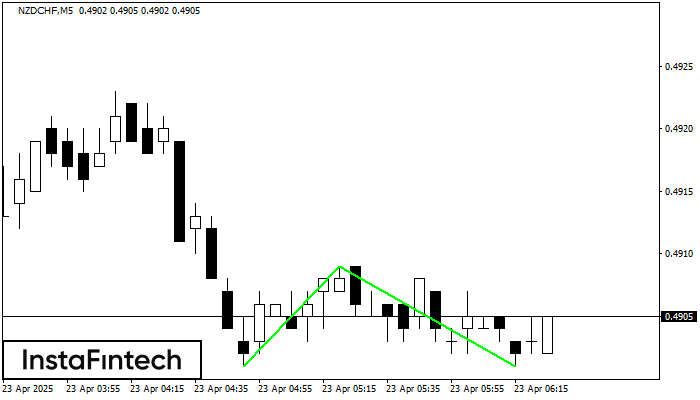
Corak Double Bottom telah dibentuk pada NZDCHF M5. Pembentukan ini menandakan pembalikan aliran dari aliran menurun ke atas. Isyarat ialah perdagangan membeli harus dibuka selepas sempadan atas corak 0.4909 telah
Carta masa M5 dan M15 mungkin mempunyai lebih banyak titik kemasukan palsu.
Open chart in a new window


