


signal strength 3 of 5

The Triple Top pattern has formed on the chart of the EURCAD M30. Features of the pattern: borders have an ascending angle; the lower line of the pattern has the coordinates 1.5476/1.5505 with the upper limit 1.5517/1.5519; the projection of the width is 41 points. The formation of the Triple Top figure most likely indicates a change in the trend from upward to downward. This means that in the event of a breakdown of the support level of 1.5476, the price is most likely to continue the downward movement.
- All
- Double Top
- Flag
- Head and Shoulders
- Pennant
- Rectangle
- Triangle
- Triple top
- All
- #AAPL
- #AMZN
- #Bitcoin
- #EBAY
- #FB
- #GOOG
- #INTC
- #KO
- #MA
- #MCD
- #MSFT
- #NTDOY
- #PEP
- #TSLA
- #TWTR
- AUDCAD
- AUDCHF
- AUDJPY
- AUDUSD
- EURCAD
- EURCHF
- EURGBP
- EURJPY
- EURNZD
- EURRUB
- EURUSD
- GBPAUD
- GBPCHF
- GBPJPY
- GBPUSD
- GOLD
- NZDCAD
- NZDCHF
- NZDJPY
- NZDUSD
- SILVER
- USDCAD
- USDCHF
- USDJPY
- USDRUB
- All
- M5
- M15
- M30
- H1
- D1
- All
- Buy
- Sale
- All
- 1
- 2
- 3
- 4
- 5

Corak Triple Top telah dibentuk pada carta GBPAUD M15. Ciri corak: sempadan mempunyai sudut menaik; garisan bawah corak mempunyai koordinat 2.0741/2.0753 dengan had atas 2.0774/2.0781; unjuran lebar ialah 33 mata
Carta masa M5 dan M15 mungkin mempunyai lebih banyak titik kemasukan palsu.
Open chart in a new window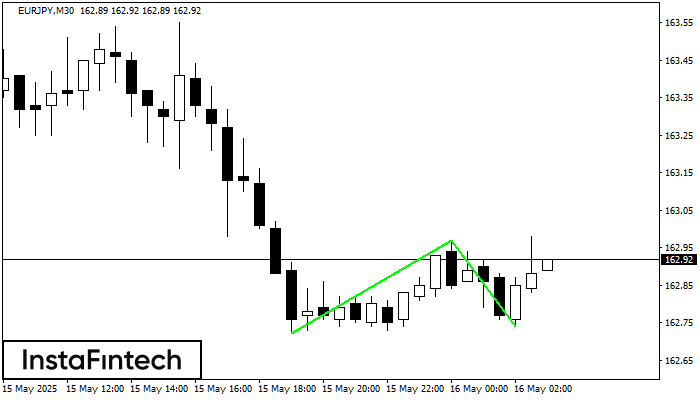
Corak Double Bottom telah dibentuk pada EURJPY M30. Pembentukan ini menandakan pembalikan aliran dari aliran menurun ke atas. Isyarat ialah perdagangan membeli harus dibuka selepas sempadan atas corak 162.97 telah
Open chart in a new window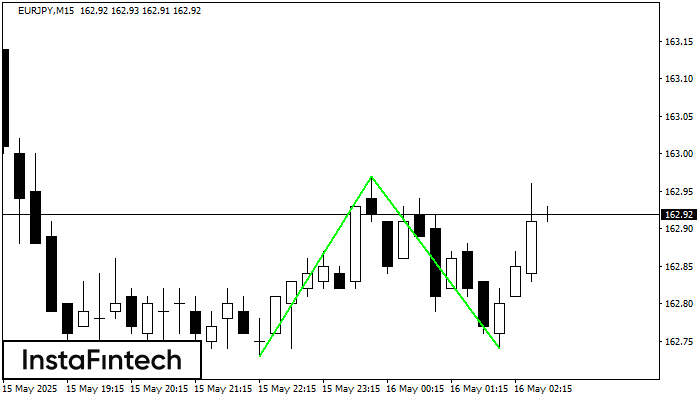
Corak Double Bottom telah dibentuk pada EURJPY M15. Ciri-ciri: tahap sokongan 162.73; tahap rintangan 162.97; lebar corak 24 mata. Sekiranya tahap rintangan ditembusi, perubahan aliran boleh diramalkan dengan titik sasaran
Carta masa M5 dan M15 mungkin mempunyai lebih banyak titik kemasukan palsu.
Open chart in a new window


