empty
was formed on 31.03 at 07:00:27 (UTC+0)
signal strength 2 of 5
Head and Shoulders GBPUSD M15

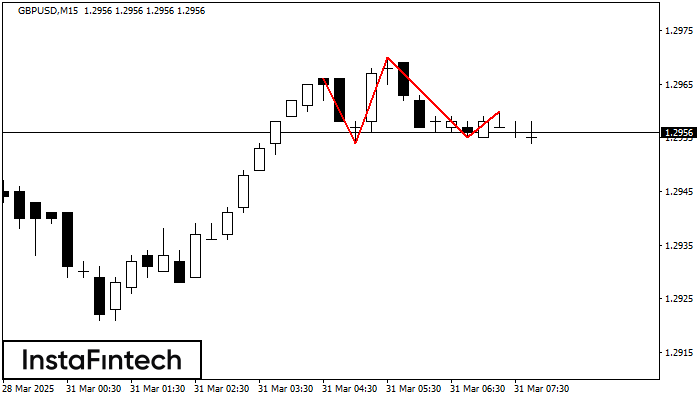
The GBPUSD M15 formed the Head and Shoulders pattern with the following features: The Head’s top is at 1.2970, the Neckline and the upward angle are at 1.2954/1.2955. The formation of this pattern can bring about changes in the current trend from bullish to bearish. In case the pattern triggers the expected changes, the price of GBPUSD will go towards 1.2932.

The M5 and M15 time frames may have more false entry points.

See Also

Figure
  • All
  • Double Top
  • Flag
  • Head and Shoulders
  • Pennant
  • Rectangle
  • Triangle
  • Triple top
Instrument
  • All
  • #AAPL
  • #AMZN
  • #Bitcoin
  • #EBAY
  • #FB
  • #GOOG
  • #INTC
  • #KO
  • #MA
  • #MCD
  • #MSFT
  • #NTDOY
  • #PEP
  • #TSLA
  • #TWTR
  • AUDCAD
  • AUDCHF
  • AUDJPY
  • AUDUSD
  • EURCAD
  • EURCHF
  • EURGBP
  • EURJPY
  • EURNZD
  • EURRUB
  • EURUSD
  • GBPAUD
  • GBPCHF
  • GBPJPY
  • GBPUSD
  • GOLD
  • NZDCAD
  • NZDCHF
  • NZDJPY
  • NZDUSD
  • SILVER
  • USDCAD
  • USDCHF
  • USDJPY
  • USDRUB
Timeframe
  • All
  • M5
  • M15
  • M30
  • H1
  • D1
Trend
  • All
  • Buy
  • Sale
Signal Strength
  • All
  • 1
  • 2
  • 3
  • 4
  • 5
รูปแบบกราฟจุดสองยอด (Double Top)
was formed on 25.04 at 21:15:57 (UTC+0)
signal strength 1 of 5
รูปแบบกราฟจุดสองยอด (Double Top) AUDCAD M5

รูปแบบ รูปแบบกราฟจุดสองยอด (Double Top) ถูกสร้างขึ้นมาใน AUDCAD M5 มันแสดงให้เห็นว่า แนวโน้มได้มีการเปลี่ยนแปลงจากแนวโน้มขาขึ้น ไปเป็นขาลง บางที ถ้ามีการเคลื่อนตัวทะลุผ่าน ฐานของรูปแบบออกไป 0.8861 การเคลื่อนไหวลงด้านล่างจะยังคงเกิดขึ้น

ขอบเตระยะเวลาใน M5 และ M15 อาจจะมีตำแหน่งการเข้าใช้งานที่ผิดพลาดมากยิ่งขึ้น

Open chart in a new window
รูปแบบกราฟธงปลายแหลมขาขึ้น (Bullish pennant)
was formed on 25.04 at 21:08:27 (UTC+0)
signal strength 1 of 5
รูปแบบกราฟธงปลายแหลมขาขึ้น (Bullish pennant) AUDCAD M5

สัญญาณ รูปแบบกราฟธงปลายแหลมขาขึ้น (Bullish pennant) – ตราสารการซื้อขาย AUDCAD M5 เป็นรูปแบบความต่อเนื่อง การคาดการณ์: มันเป็นไปได้ที่จะกำหนดสถานะแบบซื้อ ไว้สูงกว่าระดับสูงสุดของกราฟรูปแบบนี้ใน 0.8872 พร้อมกับแนวโน้มที่อาจจะมีการเคลื่อนตัวครั้งต่อไปที่จะกลายมาเป็นระดับสูงของเสาธง

ขอบเตระยะเวลาใน M5 และ M15 อาจจะมีตำแหน่งการเข้าใช้งานที่ผิดพลาดมากยิ่งขึ้น

Open chart in a new window
รูปแบบกราฟจุดสองยอดขาลง (Double Bottom)
was formed on 25.04 at 20:55:55 (UTC+0)
signal strength 1 of 5
รูปแบบกราฟจุดสองยอดขาลง (Double Bottom) GBPCHF M5

รูปแบบ รูปแบบกราฟจุดสองยอดขาลง (Double Bottom) ถูกสร้างขึ้นมาใน GBPCHF M5 การก่อตัวเช่นนี้แสดงถึงการย้อนตัวของแนวโน้มจากด้านล่าง ขึ้นมายังด้านบน สัญญาณแสดงให้เห็นถึง การเทรดแบบการซื้อที่ควรเปิด หลังจากที่มีการเคลื่อนตัวทะลุผ่านขอบเขตด้านบนของรูปแบบ 1.1029 การเคลื่อนไหวต่อจากนั้นจะอยู่ในความกว้างของรูปแบบปัจจุบัน

ขอบเตระยะเวลาใน M5 และ M15 อาจจะมีตำแหน่งการเข้าใช้งานที่ผิดพลาดมากยิ่งขึ้น

Open chart in a new window
现在无法通话?
提出您的问题,用 在线帮助.
Widget callback
 

Dear visitor,

Your IP address shows that you are currently located in the USA. If you are a resident of the United States, you are prohibited from using the services of InstaFintech Group including online trading, online transfers, deposit/withdrawal of funds, etc.

If you think you are seeing this message by mistake and your location is not the US, kindly proceed to the website. Otherwise, you must leave the website in order to comply with government restrictions.

Why does your IP address show your location as the USA?

  • - you are using a VPN provided by a hosting company based in the United States;
  • - your IP does not have proper WHOIS records;
  • - an error occurred in the WHOIS geolocation database.

Please confirm whether you are a US resident or not by clicking the relevant button below. If you choose the wrong option, being a US resident, you will not be able to open an account with InstaForex anyway.

We are sorry for any inconvenience caused by this message.