

signal strength 1 of 5
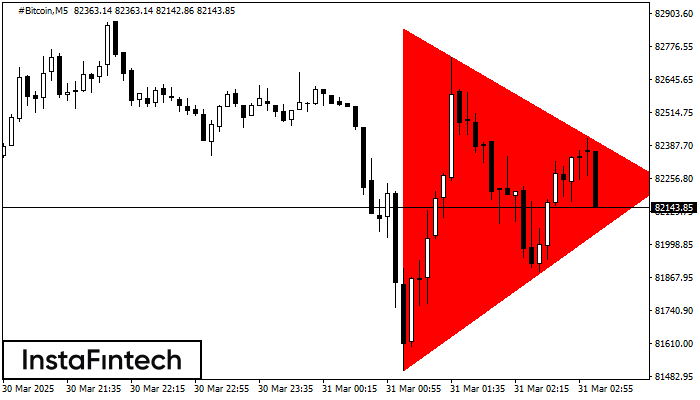
According to the chart of M5, #Bitcoin formed the Bearish Symmetrical Triangle pattern. Description: The lower border is 81505.64/82241.48 and upper border is 82843.91/82241.48. The pattern width is measured on the chart at -133827 pips. The formation of the Bearish Symmetrical Triangle pattern evidently signals a continuation of the downward trend. In other words, if the scenario comes true and #Bitcoin breaches the lower border, the price could continue its move toward 82241.33.
The M5 and M15 time frames may have more false entry points.
- All
- Double Top
- Flag
- Head and Shoulders
- Pennant
- Rectangle
- Triangle
- Triple top
- All
- #AAPL
- #AMZN
- #Bitcoin
- #EBAY
- #FB
- #GOOG
- #INTC
- #KO
- #MA
- #MCD
- #MSFT
- #NTDOY
- #PEP
- #TSLA
- #TWTR
- AUDCAD
- AUDCHF
- AUDJPY
- AUDUSD
- EURCAD
- EURCHF
- EURGBP
- EURJPY
- EURNZD
- EURRUB
- EURUSD
- GBPAUD
- GBPCHF
- GBPJPY
- GBPUSD
- GOLD
- NZDCAD
- NZDCHF
- NZDJPY
- NZDUSD
- SILVER
- USDCAD
- USDCHF
- USDJPY
- USDRUB
- All
- M5
- M15
- M30
- H1
- D1
- All
- Buy
- Sale
- All
- 1
- 2
- 3
- 4
- 5
was formed on 14.05 at 09:39:42 (UTC+0)
signal strength 3 of 5
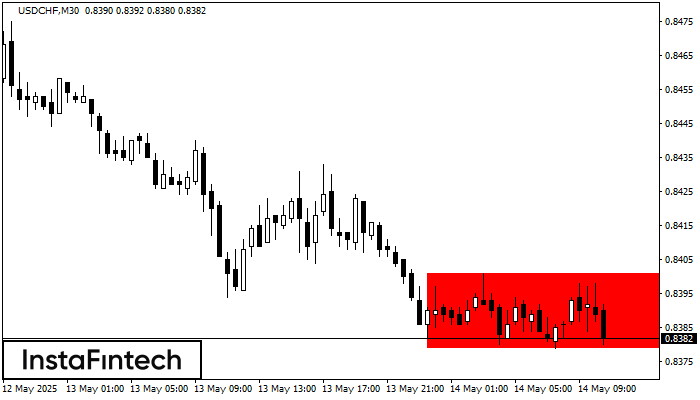
อ้างอิงจากชาร์ตของ M30, USDCHF ที่ได้สร้างรูปแบบ รูปแบบกราฟสี่เหลี่ยมผืนผ้าขาลง (Bearish Rectangle) ออกมา ซึ่งเป็นรูปแบบของ ความต่อเนื่องในแนวโน้ม รูปแบบนี้จะอยู่ภายในขอบเขตดังต่อไปนี้: ขอบเขตด้านล่าง 0.8379 – 0.8379
Open chart in a new windowwas formed on 14.05 at 09:05:23 (UTC+0)
signal strength 1 of 5

อ้างอิงจากชาร์ตของ M5, EURJPY ที่ได้สร้างรูปแบบ รูปแบบกราฟหัวและหัวไหล่แบบกลับหัว (Inverse Head and Shoulder) ออกมา ระดับสูงสุดของตำแหน่งหัวอยู่ที่ 164.66 ในขณะที่เส้นระดับกลางของแนวคอ จะอยู่ที่ 164.28/164.55
ขอบเตระยะเวลาใน M5 และ M15 อาจจะมีตำแหน่งการเข้าใช้งานที่ผิดพลาดมากยิ่งขึ้น
Open chart in a new windowwas formed on 14.05 at 09:03:44 (UTC+0)
signal strength 4 of 5
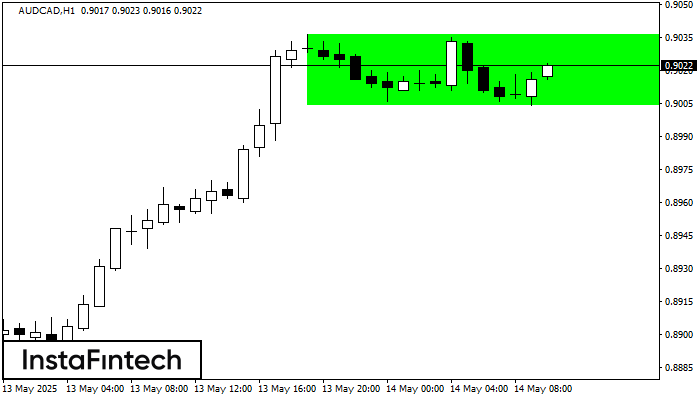
อ้างอิงจากชาร์ตของ H1, AUDCAD ที่ได้สร้างรูปแบบ รูปแบบกราฟสี่เหลี่ยมผืนผ้าขาขึ้น (Bullish Rectangle) ออกมา รูปแบบนี้แสดงถึง ความต่อเนื่องในแนวโน้ม ขอบเขตด้านบนคือ 0.9036 ส่วน ขอบเขตด้านล่างคือ 0.9004
Open chart in a new window


