


signal strength 4 of 5
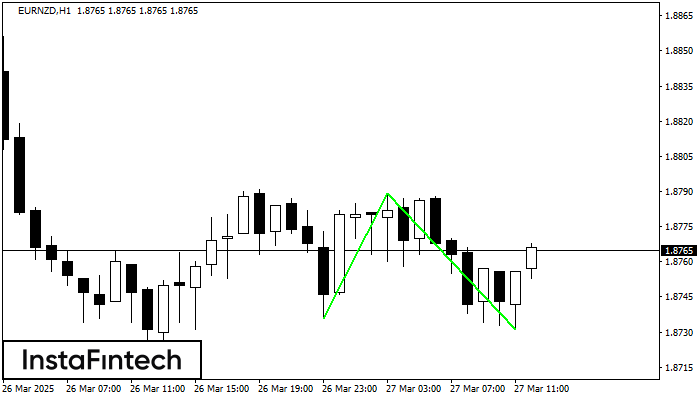
The Double Bottom pattern has been formed on EURNZD H1. This formation signals a reversal of the trend from downwards to upwards. The signal is that a buy trade should be opened after the upper boundary of the pattern 1.8789 is broken. The further movements will rely on the width of the current pattern 53 points.
See Also
- All
- Double Top
- Flag
- Head and Shoulders
- Pennant
- Rectangle
- Triangle
- Triple top
- All
- #AAPL
- #AMZN
- #Bitcoin
- #EBAY
- #FB
- #GOOG
- #INTC
- #KO
- #MA
- #MCD
- #MSFT
- #NTDOY
- #PEP
- #TSLA
- #TWTR
- AUDCAD
- AUDCHF
- AUDJPY
- AUDUSD
- EURCAD
- EURCHF
- EURGBP
- EURJPY
- EURNZD
- EURRUB
- EURUSD
- GBPAUD
- GBPCHF
- GBPJPY
- GBPUSD
- GOLD
- NZDCAD
- NZDCHF
- NZDJPY
- NZDUSD
- SILVER
- USDCAD
- USDCHF
- USDJPY
- USDRUB
- All
- M5
- M15
- M30
- H1
- D1
- All
- Buy
- Sale
- All
- 1
- 2
- 3
- 4
- 5
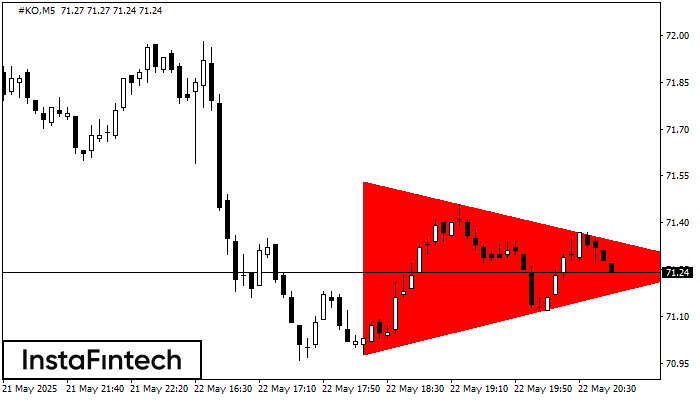
According to the chart of M5, #KO formed the Bearish Symmetrical Triangle pattern. Trading recommendations: A breach of the lower border 70.98 is likely to encourage a continuation
The M5 and M15 time frames may have more false entry points.
Open chart in a new window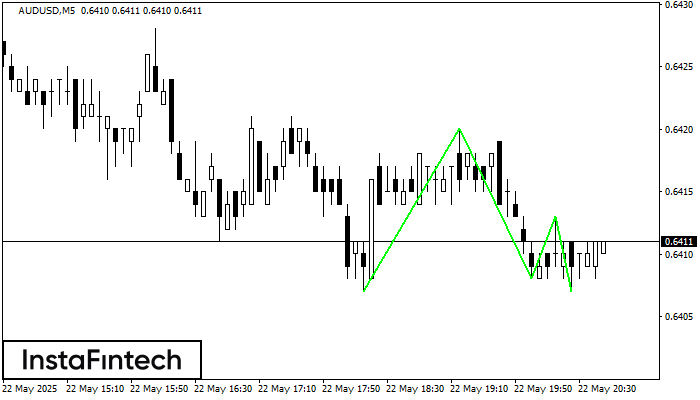
The Triple Bottom pattern has formed on the chart of AUDUSD M5. Features of the pattern: The lower line of the pattern has coordinates 0.6420 with the upper limit 0.6420/0.6413
The M5 and M15 time frames may have more false entry points.
Open chart in a new window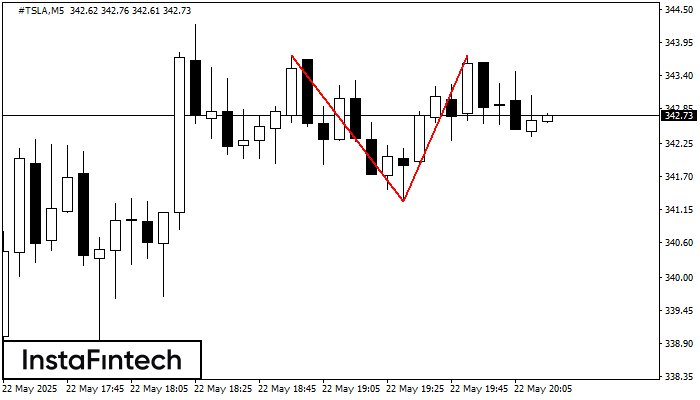
The Double Top reversal pattern has been formed on #TSLA M5. Characteristics: the upper boundary 343.73; the lower boundary 341.29; the width of the pattern is 245 points. Sell trades
The M5 and M15 time frames may have more false entry points.
Open chart in a new window


