

signal strength 1 of 5

According to the chart of M5, GBPCHF formed the Head and Shoulders pattern. The Head’s top is set at 1.1418 while the median line of the Neck is found at 1.1408/1.1408. The formation of the Head and Shoulders pattern evidently signals a reversal of the upward trend. In other words, in case the scenario comes true, the price of GBPCHF will go towards 1.1393.
The M5 and M15 time frames may have more false entry points.
- All
- Double Top
- Flag
- Head and Shoulders
- Pennant
- Rectangle
- Triangle
- Triple top
- All
- #AAPL
- #AMZN
- #Bitcoin
- #EBAY
- #FB
- #GOOG
- #INTC
- #KO
- #MA
- #MCD
- #MSFT
- #NTDOY
- #PEP
- #TSLA
- #TWTR
- AUDCAD
- AUDCHF
- AUDJPY
- AUDUSD
- EURCAD
- EURCHF
- EURGBP
- EURJPY
- EURNZD
- EURRUB
- EURUSD
- GBPAUD
- GBPCHF
- GBPJPY
- GBPUSD
- GOLD
- NZDCAD
- NZDCHF
- NZDJPY
- NZDUSD
- SILVER
- USDCAD
- USDCHF
- USDJPY
- USDRUB
- All
- M5
- M15
- M30
- H1
- D1
- All
- Buy
- Sale
- All
- 1
- 2
- 3
- 4
- 5
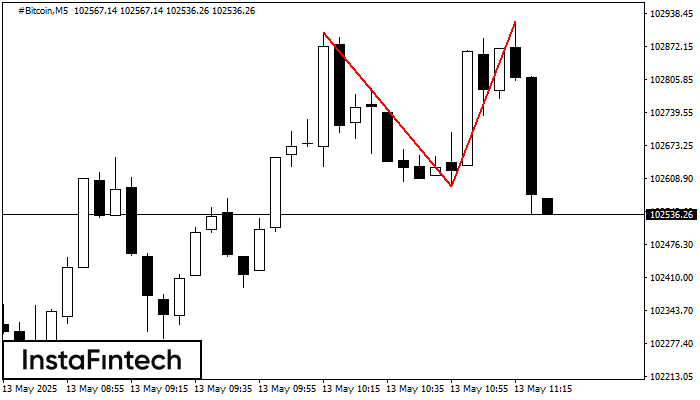
On the chart of #Bitcoin M5 the Double Top reversal pattern has been formed. Characteristics: the upper boundary 102921.94; the lower boundary 102591.19; the width of the pattern 33075 points
The M5 and M15 time frames may have more false entry points.
Open chart in a new window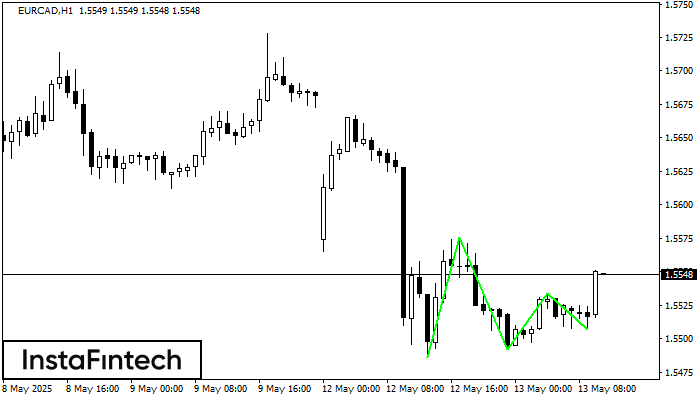
The Triple Bottom pattern has been formed on EURCAD H1. It has the following characteristics: resistance level 1.5576/1.5534; support level 1.5486/1.5507; the width is 90 points. In the event
Open chart in a new window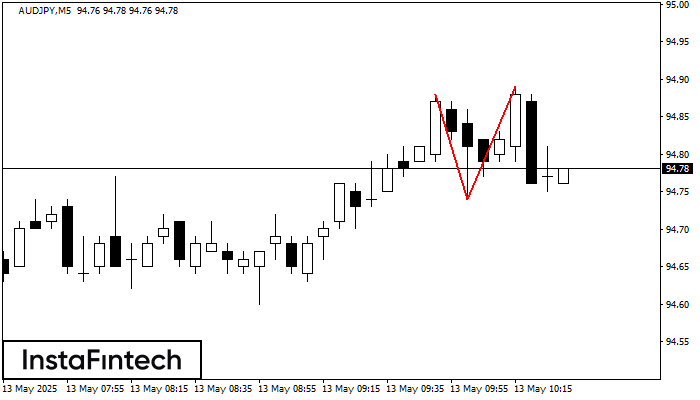
The Double Top reversal pattern has been formed on AUDJPY M5. Characteristics: the upper boundary 94.88; the lower boundary 94.74; the width of the pattern is 15 points. Sell trades
The M5 and M15 time frames may have more false entry points.
Open chart in a new window


