


signal strength 1 of 5
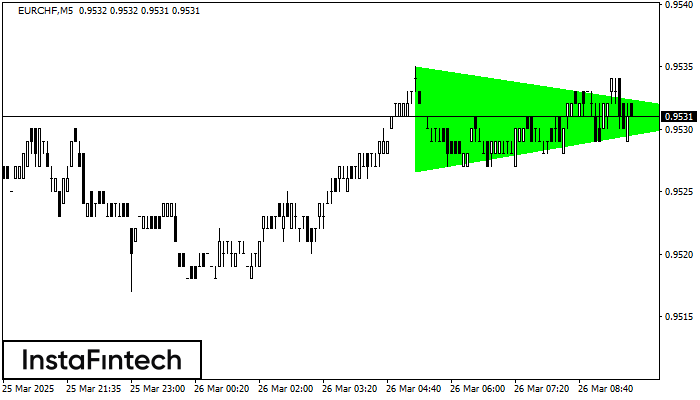
According to the chart of M5, EURCHF formed the Bullish Symmetrical Triangle pattern, which signals the trend will continue. Description. The upper border of the pattern touches the coordinates 0.9535/0.9531 whereas the lower border goes across 0.9527/0.9531. The pattern width is measured on the chart at 8 pips. If the Bullish Symmetrical Triangle pattern is in progress during the upward trend, this indicates the current trend will go on. In case 0.9531 is broken, the price could continue its move toward 0.9546.
The M5 and M15 time frames may have more false entry points.
- All
- Double Top
- Flag
- Head and Shoulders
- Pennant
- Rectangle
- Triangle
- Triple top
- All
- #AAPL
- #AMZN
- #Bitcoin
- #EBAY
- #FB
- #GOOG
- #INTC
- #KO
- #MA
- #MCD
- #MSFT
- #NTDOY
- #PEP
- #TSLA
- #TWTR
- AUDCAD
- AUDCHF
- AUDJPY
- AUDUSD
- EURCAD
- EURCHF
- EURGBP
- EURJPY
- EURNZD
- EURRUB
- EURUSD
- GBPAUD
- GBPCHF
- GBPJPY
- GBPUSD
- GOLD
- NZDCAD
- NZDCHF
- NZDJPY
- NZDUSD
- SILVER
- USDCAD
- USDCHF
- USDJPY
- USDRUB
- All
- M5
- M15
- M30
- H1
- D1
- All
- Buy
- Sale
- All
- 1
- 2
- 3
- 4
- 5

Mô hình Đáy ba đã được hình thành trên #Bitcoin M5. Nó có các đặc điểm sau: mức kháng cự 84720.65/84653.62; mức hỗ trợ 84401.53/84425.81; chiều rộng là 31912 điểm
Khung thời gian M5 và M15 có thể có nhiều điểm vào lệnh sai hơn.
Open chart in a new window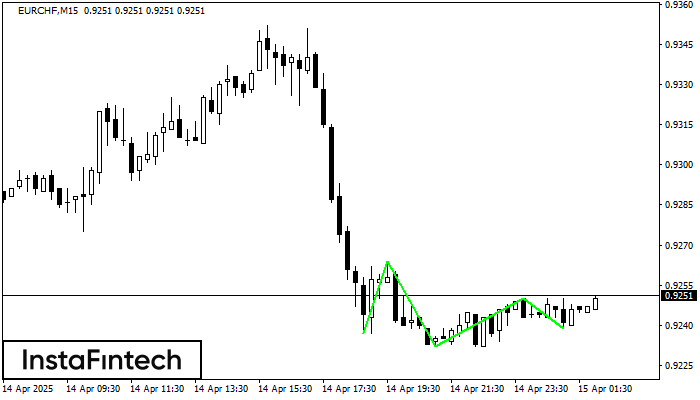
Mô hình Đáy ba đã được hình thành trên biểu đồ của công cụ giao dịch EURCHF M15. Mô hình này báo hiệu một sự thay đổi trong xu hướng
Khung thời gian M5 và M15 có thể có nhiều điểm vào lệnh sai hơn.
Open chart in a new window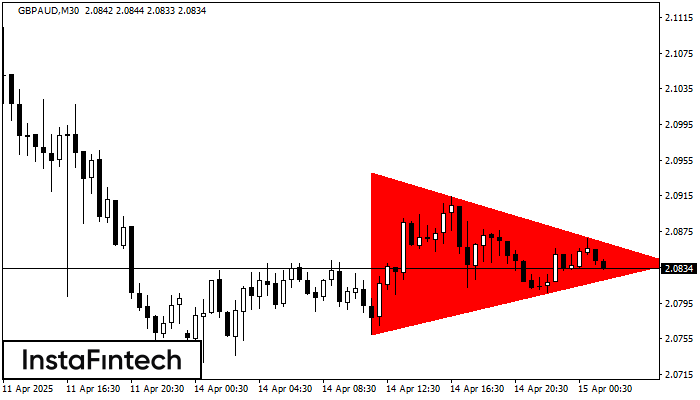
Theo biểu đồ của M30, GBPAUD đã hình thành mô hình Tam giác Cân Giảm. Mô hình này báo hiệu xu hướng giảm hơn nữa trong trường hợp đường biên
Open chart in a new window


