


signal strength 2 of 5

The #Bitcoin M15 formed the Head and Shoulders pattern with the following features: The Head’s top is at 88742.88, the Neckline and the upward angle are at 87100.22/87010.53. The formation of this pattern can bring about changes in the current trend from bullish to bearish. In case the pattern triggers the expected changes, the price of #Bitcoin will go towards 87010.30.
The M5 and M15 time frames may have more false entry points.
See Also
- All
- Double Top
- Flag
- Head and Shoulders
- Pennant
- Rectangle
- Triangle
- Triple top
- All
- #AAPL
- #AMZN
- #Bitcoin
- #EBAY
- #FB
- #GOOG
- #INTC
- #KO
- #MA
- #MCD
- #MSFT
- #NTDOY
- #PEP
- #TSLA
- #TWTR
- AUDCAD
- AUDCHF
- AUDJPY
- AUDUSD
- EURCAD
- EURCHF
- EURGBP
- EURJPY
- EURNZD
- EURRUB
- EURUSD
- GBPAUD
- GBPCHF
- GBPJPY
- GBPUSD
- GOLD
- NZDCAD
- NZDCHF
- NZDJPY
- NZDUSD
- SILVER
- USDCAD
- USDCHF
- USDJPY
- USDRUB
- All
- M5
- M15
- M30
- H1
- D1
- All
- Buy
- Sale
- All
- 1
- 2
- 3
- 4
- 5

The Bearish Flag pattern has been formed on the chart GBPJPY M5. Therefore, the downwards trend is likely to continue in the nearest term. As soon as the price breaks
The M5 and M15 time frames may have more false entry points.
Open chart in a new window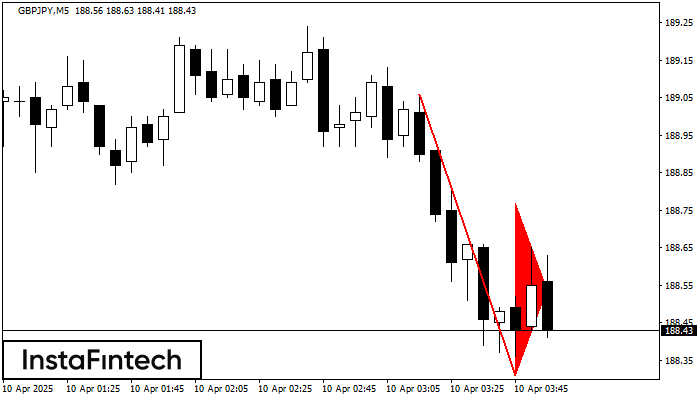
The Bearish pennant pattern has formed on the GBPJPY M5 chart. It signals potential continuation of the existing trend. Specifications: the pattern’s bottom has the coordinate of 188.31; the projection
The M5 and M15 time frames may have more false entry points.
Open chart in a new window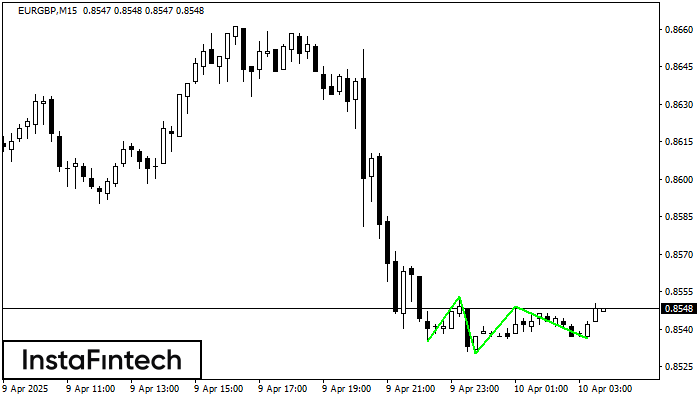
The Triple Bottom pattern has formed on the chart of the EURGBP M15 trading instrument. The pattern signals a change in the trend from downwards to upwards in the case
The M5 and M15 time frames may have more false entry points.
Open chart in a new window


