Review :
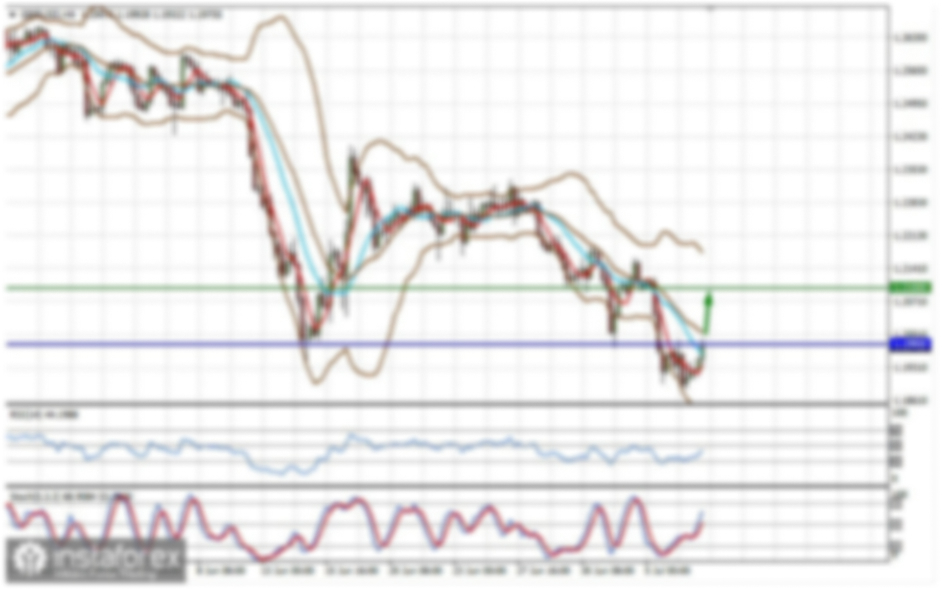
All elements being clearly bullish market, it would be possible for traders to trade only long positions on the EUR/USD pair as long as the price remains well above the price of 1.0452. The EUR/USD pair will continue rising from the level of 1.0452 in the long term. It should be noted that the support is established at the level of 1.0452 which represents the last bearish wave. The price is likely to form a double bottom in the same time frame. Accordingly, the EUR/USD pair is showing signs of strength following a breakout of the highest level of 1.0459. So, buy above the level of 1.0452 with the first target at 1.0512 in order to test the daily resistance 1. The buyers' bullish objective is set at the level of 1.0512.
A bullish break in this resistance would boost the bullish momentum. The buyers could then target the resistance located at 1.0512. This suggests that the pair will probably go up in coming hours. If the trend is able to break the level of 1.0512, then the market will call for a strong bullish market towards the objective of 1.0592 this week. If there is any crossing, the next objective would be the resistance located at 1.0592. The level of 1.0592 is a good place to take profits. Moreover, the RSI is still signaling that the trend is upward as it remains strong above the moving average (100).
Since the trend is above the price of 1.0452 (61.8% Fibonacci level), it means the market is still in an uptrend. From this point, the EUR/USD pair is continuing in a bullish trend from the new support of 1.0452. This is shown to us as the current price is in a bullish channel. According to the previous events, we expect that the EUR/USD pair will move between 1.0452 and 1.0592.
The EUR/USD pair has faced strong resistances at the levels of 1.0512 because support had become resistance on Nov. 29, 2022. So, the strong resistance has been already formed at the level of 1.0512 and the pair is likely to try to approach it in order to test it again. However, if the pair fails to pass through the level of 1.0512, the market will indicate a bearish opportunity below the new strong resistance level of 1.0512 (the level of 1.0512 coincides with a ratio of 78% Fibonacci).
Moreover, the RSI starts signaling a downward trend, as the trend is still showing strength above the moving average (100) and (50). The EUR/USD pair continues to move downwards from the level of 1.0480. Yesterday, the pair dropped from the level of 1.0480 to the bottom around 1.0300. But the pair has rebounded from the bottom of 1.0300 to close at 1.0333. The EUR/USD pair's outlook and further decline is expected with 1.0512 minor resistance intact.
Current down trend should move from the last resistance levels of 1.0512 and 1.0482. Firm break there could prompt downside acceleration to last bearish wave of 1.0512 and 1.0482 (these resistance levels have been rejected several times confirming the veracity of a downtrend).
Today, the first support level is seen at 1.0300, the price is moving in a bearish channel now. Furthermore, the price has been set below the minor resistance at the level of 1.0284, which coincides with the 23.6% Fibonacci retracement level. Thus, the market is indicating a bearish opportunity below 1.0512 so it will be good to sell at 1.0512 with the first target of 1.0300. It will also call for a downtrend in order to continue towards 1.0271. The daily strong support is seen at 1.0271. On other hand, the stop loss should always be taken into account, for that it will be reasonable to set your stop loss at the level of 1.0480.
According to previous events, the EUR/USD pair is still moving between the level of 1.0480 and the 1.0284 level (these levels coincided with the Fibonacci retracement levels 23.6% and last bullish wave). It should be noted that the 1.0512 price will act as a minor resistance today. Therefore, it will be too gainful to sell short below 1.0512 and look for further downside with 1.0300 and 1.0284 targets. It should also be reminded that stop loss must never exceed the maximum exposure amounts. Thus, stop loss should be placed at the 1.0480 level today.
In coming 2 -3 days : The bullish trend is currently very strong on the EUR/USD pair. As long as the price remains above the support levels of 1.0478 and 0.9700, you could try to benefit from the growth. The first bullish objective is located at the price of 1.0594. The bullish momentum would be boosted by a break in this resistance (1.0527). The hourly chart is currently still bullish. At the same time, some stabilization tendencies are visible between 1.0527 and 1.0594 in a few minutes. Together with the relatively large distance to the fast-rising 100-day moving average (1.0527), there are some arguments for a relief rally in coming months on the table. The EUR/USD pair is at highest against the dollar around the spot of 1.0478 and 1.0500 this week - the EUR/USD pair is inside in upward channel. The EUR/USD pair decreased within an up channel, for that the EUR/USD pair its new highest 1.0594. Consequently, the first support is set at the level of 1.0527. Hence, the market is likely to show signs of a bullish trend around the area of 1.0527.
Moreover, the double bottom is also coinciding with the major support this week. Additionally, the RSI is still calling for a strong bullish market as well as the current price is also above the moving average 100. Therefore, it will be advantageous to buy above the support area of 1.0478. Commonly, traders use the RSI (Relative Strength Index) to define what? Areas that are potentially overbought or oversold. Overall, RSI readings below 30 indicate that the pair is oversold, while RSI readings over 70 indicate that it is overbought. Buyers would then use the next resistance located at 1.0594 as an objective. Crossing it would then enable buyers to target 1.0594 (the double top - last bullish week).
Be careful, given the powerful bullish rally underway, excesses could lead to a possible correction in the short term. If this is the case, remember that trading against the trend may be riskier. It would seem more appropriate to wait for a signal indicating reversal of the trend. The EUR/USD pair price could be awaiting a major upswing if the digital savings manages to slice above a fatal line of the first resistance that sets at the price of 1.0594 (Horizontal red line). The prevailing chart pattern suggests that if the leading pair could be expecting to rebound from the levels of 1.0500 and 1.0594 .
On the day, this instrument gained abou +0.85% and was traded between 1.0500 and 1.0600 USD over the period. The price is currently at +1.25% from its lowest and -0.25% from its highest. If the EUR/USD pair fails to break through the support prices of 1.0478 USD today, the market will rise further to 1.0594 so as to try to break it. The EUR/USD pair is one the best overall investment for December 08, 2022. However, if you want to try to improve the growth of the EUR/USD pair, thus it seems great to buy above the last bearish waves of 1.0478. Re-buy orders are recommended above the major resistance rates of (0.9898) with the second target at the level of 1 USD.
Furthermore, if the trend is able to breakout through the second resistance level of 1.0640 USD. We should see the pair climbing towards the next target of 1.0640 The pair will move upwards continuing the development of the bullish trend to the level 1.0640. It might be noted that the level of 1.0640 is a good place to take profit because it will form a new double top in coming hours. The general bullish opinion of this analysis is in opposition with technical indicators. As long as the invalidation level of this analysis is not breached, the bullish direction is still favored, however the current short-term correction should be carefully watched. The bulls must break through 1.0550 in order to resume the uptrend.