

signal strength 1 of 5

The Bearish Flag pattern has been formed on the chart GOLD M5. Therefore, the downwards trend is likely to continue in the nearest term. As soon as the price breaks below the low at 2993.55, traders should enter the market.
The M5 and M15 time frames may have more false entry points.
- All
- Double Top
- Flag
- Head and Shoulders
- Pennant
- Rectangle
- Triangle
- Triple top
- All
- #AAPL
- #AMZN
- #Bitcoin
- #EBAY
- #FB
- #GOOG
- #INTC
- #KO
- #MA
- #MCD
- #MSFT
- #NTDOY
- #PEP
- #TSLA
- #TWTR
- AUDCAD
- AUDCHF
- AUDJPY
- AUDUSD
- EURCAD
- EURCHF
- EURGBP
- EURJPY
- EURNZD
- EURRUB
- EURUSD
- GBPAUD
- GBPCHF
- GBPJPY
- GBPUSD
- GOLD
- NZDCAD
- NZDCHF
- NZDJPY
- NZDUSD
- SILVER
- USDCAD
- USDCHF
- USDJPY
- USDRUB
- All
- M5
- M15
- M30
- H1
- D1
- All
- Buy
- Sale
- All
- 1
- 2
- 3
- 4
- 5

Mô hình Cờ hiệu giảm đã được hình thành trên biểu đồ #TSLA M5. Mô hình này báo hiệu sự tiếp tục của xu hướng giảm trong trường
Khung thời gian M5 và M15 có thể có nhiều điểm vào lệnh sai hơn.
Open chart in a new window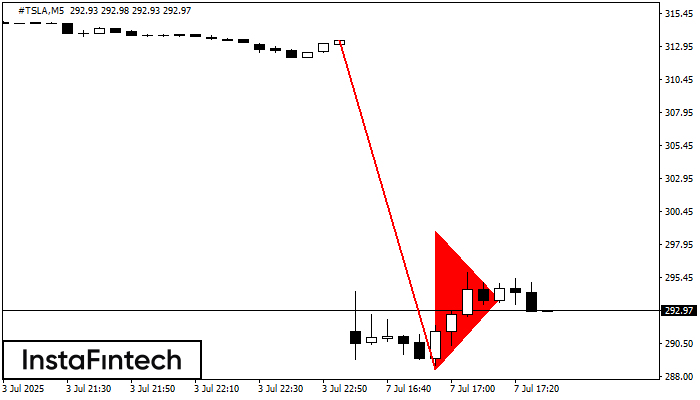
Mô hình Cờ hiệu giảm đã được hình thành trên biểu đồ #TSLA M5. Mô hình này báo hiệu sự tiếp tục của xu hướng giảm trong trường
Khung thời gian M5 và M15 có thể có nhiều điểm vào lệnh sai hơn.
Open chart in a new window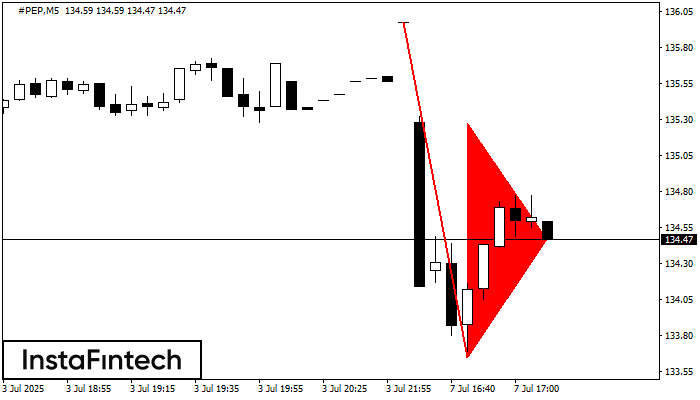
Mô hình Cờ hiệu giảm đã được hình thành trên biểu đồ #PEP M5. Nó báo hiệu tiềm năng tiếp tục của xu hướng hiện tại. Thông số kỹ thuật
Khung thời gian M5 và M15 có thể có nhiều điểm vào lệnh sai hơn.
Open chart in a new window


