


signal strength 1 of 5

The Triple Bottom pattern has been formed on #Bitcoin M5. It has the following characteristics: resistance level 84720.65/84653.62; support level 84401.53/84425.81; the width is 31912 points. In the event of a breakdown of the resistance level of 84720.65, the price is likely to continue an upward movement at least to 84378.00.
The M5 and M15 time frames may have more false entry points.
- All
- Double Top
- Flag
- Head and Shoulders
- Pennant
- Rectangle
- Triangle
- Triple top
- All
- #AAPL
- #AMZN
- #Bitcoin
- #EBAY
- #FB
- #GOOG
- #INTC
- #KO
- #MA
- #MCD
- #MSFT
- #NTDOY
- #PEP
- #TSLA
- #TWTR
- AUDCAD
- AUDCHF
- AUDJPY
- AUDUSD
- EURCAD
- EURCHF
- EURGBP
- EURJPY
- EURNZD
- EURRUB
- EURUSD
- GBPAUD
- GBPCHF
- GBPJPY
- GBPUSD
- GOLD
- NZDCAD
- NZDCHF
- NZDJPY
- NZDUSD
- SILVER
- USDCAD
- USDCHF
- USDJPY
- USDRUB
- All
- M5
- M15
- M30
- H1
- D1
- All
- Buy
- Sale
- All
- 1
- 2
- 3
- 4
- 5
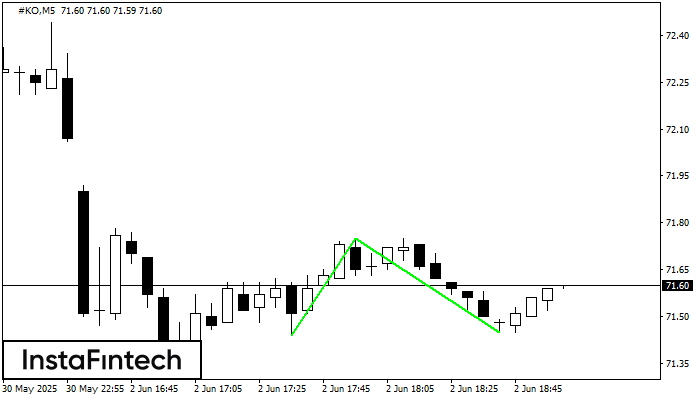
The Double Bottom pattern has been formed on #KO M5. This formation signals a reversal of the trend from downwards to upwards. The signal is that a buy trade should
The M5 and M15 time frames may have more false entry points.
Open chart in a new window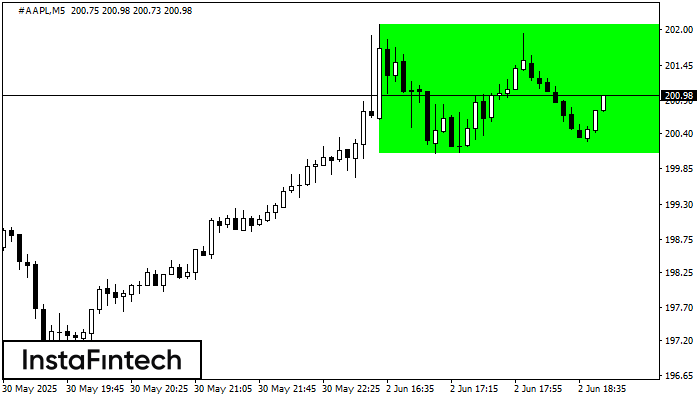
According to the chart of M5, #AAPL formed the Bullish Rectangle. The pattern indicates a trend continuation. The upper border is 202.09, the lower border is 200.08. The signal means
The M5 and M15 time frames may have more false entry points.
Open chart in a new window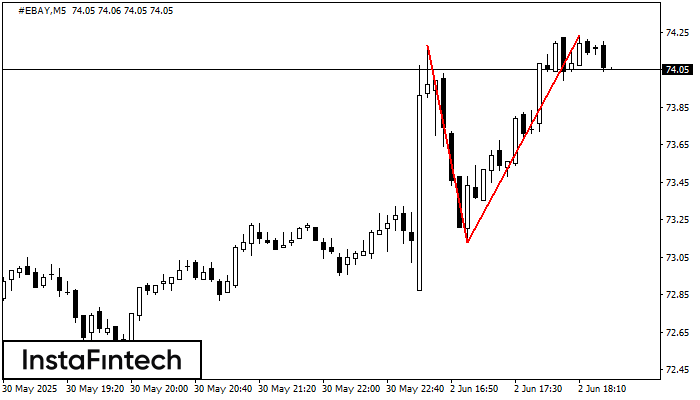
On the chart of #EBAY M5 the Double Top reversal pattern has been formed. Characteristics: the upper boundary 74.23; the lower boundary 73.13; the width of the pattern 110 points
The M5 and M15 time frames may have more false entry points.
Open chart in a new window


