


signal strength 3 of 5

According to the chart of M30, EURCAD formed the Bullish Symmetrical Triangle pattern. The lower border of the pattern touches the coordinates 1.5415/1.5608 whereas the upper border goes across 1.5743/1.5608. If the Bullish Symmetrical Triangle pattern is in progress, this evidently signals a further upward trend. In other words, in case the scenario comes true, the price of EURCAD will breach the upper border to head for 1.5638.
انظر أيضا
- All
- Double Top
- Flag
- Head and Shoulders
- Pennant
- Rectangle
- Triangle
- Triple top
- All
- #AAPL
- #AMZN
- #Bitcoin
- #EBAY
- #FB
- #GOOG
- #INTC
- #KO
- #MA
- #MCD
- #MSFT
- #NTDOY
- #PEP
- #TSLA
- #TWTR
- AUDCAD
- AUDCHF
- AUDJPY
- AUDUSD
- EURCAD
- EURCHF
- EURGBP
- EURJPY
- EURNZD
- EURRUB
- EURUSD
- GBPAUD
- GBPCHF
- GBPJPY
- GBPUSD
- GOLD
- NZDCAD
- NZDCHF
- NZDJPY
- NZDUSD
- SILVER
- USDCAD
- USDCHF
- USDJPY
- USDRUB
- All
- M5
- M15
- M30
- H1
- D1
- All
- Buy
- Sale
- All
- 1
- 2
- 3
- 4
- 5
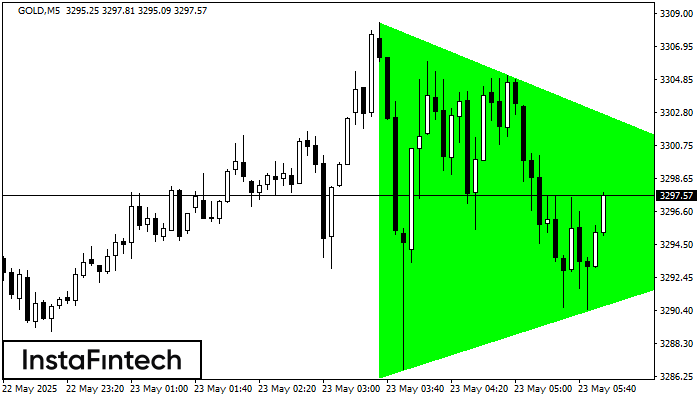
По GOLD на M5 сформировалась фигура «Бычий симметричный треугольник». Нижняя граница фигуры имеет координаты 3286.21/3295.95, при этом верхняя граница 3308.46/3295.95. Формирование фигуры «Бычий симметричный треугольник» наиболее вероятным образом свидетельствует
Таймфреймы М5 и М15 могут иметь больше ложных точек входа.
Открыть график инструмента в новом окне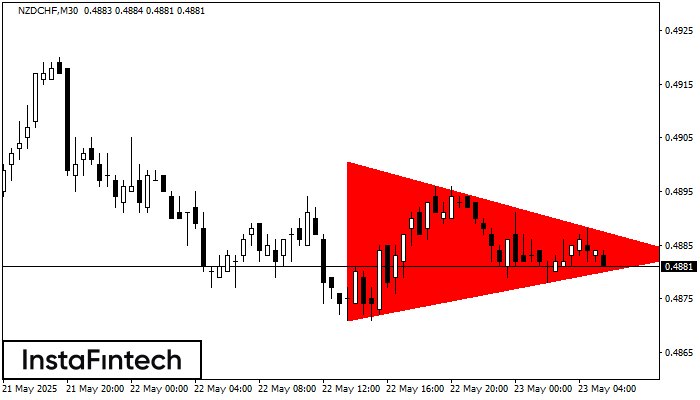
На графике NZDCHF на M30 сформировалась фигура «Медвежий симметричный треугольник». Торговые рекомендации: Пробой нижней границы 0.4871 с большой долей вероятности приведет к продолжению нисходящего тренда
Открыть график инструмента в новом окне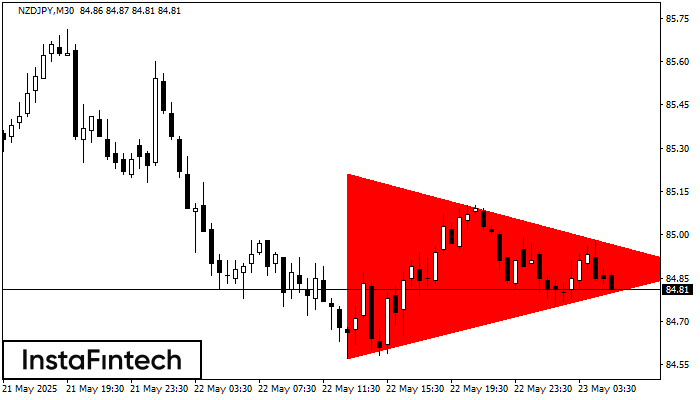
На графике NZDJPY на M30 сформировалась фигура «Медвежий симметричный треугольник». Торговые рекомендации: Пробой нижней границы 84.57 с большой долей вероятности приведет к продолжению нисходящего тренда
Открыть график инструмента в новом окне


