

signal strength 1 of 5
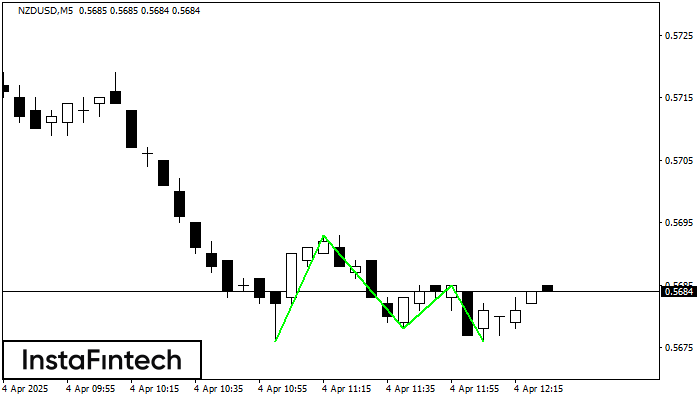
The Triple Bottom pattern has been formed on NZDUSD M5. It has the following characteristics: resistance level 0.5693/0.5685; support level 0.5676/0.5676; the width is 17 points. In the event of a breakdown of the resistance level of 0.5693, the price is likely to continue an upward movement at least to 0.5693.
The M5 and M15 time frames may have more false entry points.
انظر أيضا
- All
- Double Top
- Flag
- Head and Shoulders
- Pennant
- Rectangle
- Triangle
- Triple top
- All
- #AAPL
- #AMZN
- #Bitcoin
- #EBAY
- #FB
- #GOOG
- #INTC
- #KO
- #MA
- #MCD
- #MSFT
- #NTDOY
- #PEP
- #TSLA
- #TWTR
- AUDCAD
- AUDCHF
- AUDJPY
- AUDUSD
- EURCAD
- EURCHF
- EURGBP
- EURJPY
- EURNZD
- EURRUB
- EURUSD
- GBPAUD
- GBPCHF
- GBPJPY
- GBPUSD
- GOLD
- NZDCAD
- NZDCHF
- NZDJPY
- NZDUSD
- SILVER
- USDCAD
- USDCHF
- USDJPY
- USDRUB
- All
- M5
- M15
- M30
- H1
- D1
- All
- Buy
- Sale
- All
- 1
- 2
- 3
- 4
- 5
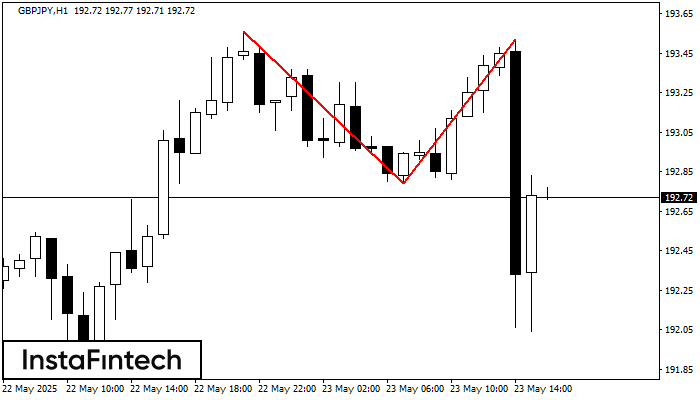
On the chart of GBPJPY H1 the Double Top reversal pattern has been formed. Characteristics: the upper boundary 193.52; the lower boundary 192.79; the width of the pattern 73 points
Open chart in a new window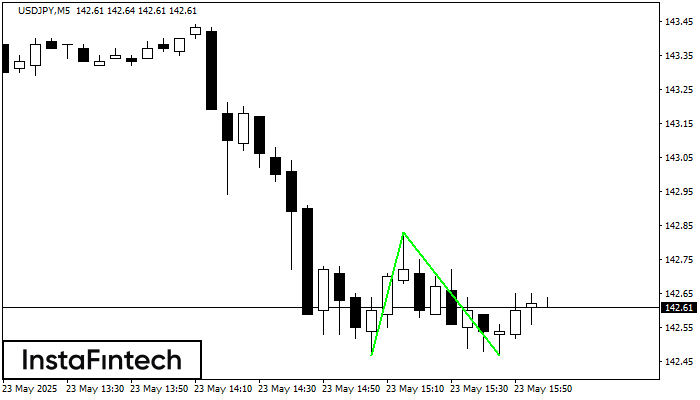
The Double Bottom pattern has been formed on USDJPY M5. Characteristics: the support level 142.47; the resistance level 142.83; the width of the pattern 36 points. If the resistance level
The M5 and M15 time frames may have more false entry points.
Open chart in a new window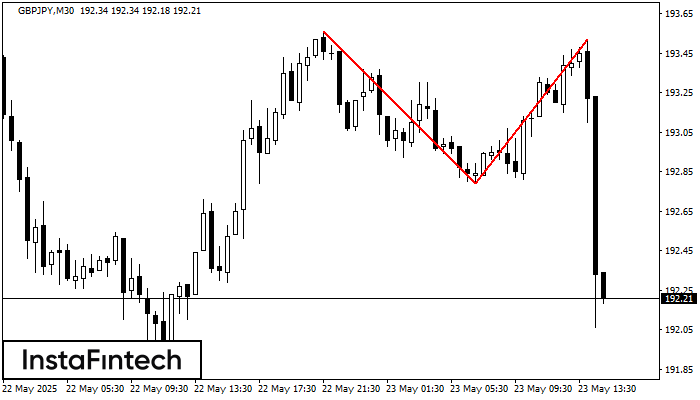
The Double Top reversal pattern has been formed on GBPJPY M30. Characteristics: the upper boundary 193.56; the lower boundary 192.79; the width of the pattern is 73 points. Sell trades
Open chart in a new window


