empty
10.04.2023 06:41 AM
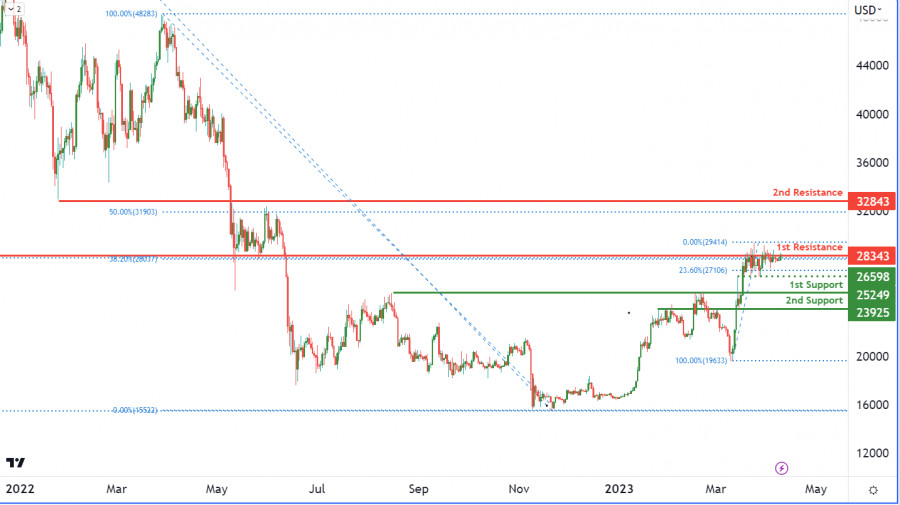
BTCUSD, Daily | Potential reversal from 1st resistance?

This image is no longer relevant

The BTC/USD chart currently reflects a bearish momentum in the cryptocurrency market, and Bitcoin seems to be following the trend. The chart suggests that the price of Bitcoin could face resistance at the 1st resistance level of 28343, which has previously been an important level as an overlap resistance. If Bitcoin fails to break through this level, it may result in a bearish reaction causing the price to drop towards the 1st support level of 25249. This level, being a pullback support, could act as a strong support for the price of Bitcoin.

In the event that the price of Bitcoin breaks through the 1st resistance level, the next resistance level it could face is the 2nd resistance level of 32843, which is a pullback resistance. Conversely, if Bitcoin breaks below the 1st support level, the next support level it could drop to is the 2nd support level of 23925. This level, also being a pullback support, could potentially act as a strong support for the price of Bitcoin.

Additionally, there is an intermediate support level at 26598, which is a swing low support and is accompanied by a 23.60% Fibonacci retracement. This level could potentially provide support to the price of Bitcoin if it drops towards the 1st support level. Overall, the BTC/USD chart's momentum is bearish, indicating that the price is expected to continue falling in the near term.

Dean Leo,
الخبير التحليلي لدى شركة إنستافوركس
© 2007-2025
حدد الإطار الزمني
5
د
15
د
30
د
1
س
4
ساعات
1
يوم
1
أسبوع
كسب عائد من تغيرات أسعار العملات المشفرة مع إنستافوركس.
قم بتحميل منصة التداول ميتاتريدر 4 وافتح أول صفقة.
  • Grand Choice
    Contest by
    InstaForex
    InstaForex always strives to help you
    fulfill your biggest dreams.
    انضم إلى المسابقة

المقالات الموصى بها

NZD/USD. التحليل والتوقعات والوضع الحالي للسوق

يتداول زوج NZD/USD حاليًا فوق المستوى النفسي 0.6000؛ ومع ذلك، يظل عرضة لمزيد من الانخفاض وسط قوة الدولار الأمريكي الواسعة النطاق. يحظى مؤشر الدولار الأمريكي بالدعم من التوقعات بأن ارتفاع

Irina Yanina 12:00 2025-07-09 UTC+2

التوقعات لليورو/الدولار الأمريكي في 9 يوليو 2025

يوم الثلاثاء، واصل زوج اليورو/الدولار الأمريكي الانخفاض، متجاهلاً تمامًا مستوى التصحيح 127.2% عند 1.1712. هذا المستوى غير مناسب حاليًا لتحديد إشارات التداول. يجب اعتبار انخفاض اليورو كتصحيح تراجعي. يظل هيكل

Samir Klishi 11:14 2025-07-09 UTC+2

التوقعات لزوج العملات GBP/USD في 9 يوليو 2025

على الرسم البياني الساعي، سقطت الزوج GBP/USD يوم الثلاثاء إلى مستوى فيبوناتشي 127.2% عند 1.3527، وارتد منه، وتحول لصالح الجنيه الاسترليني. قد يشير هذا إلى نهاية الحركة الهابطة الأخيرة. اليوم،

Samir Klishi 11:05 2025-07-09 UTC+2

هل يمكن لـ 0.7939 الصمود أمام التصحيح المؤقت لزوج العملات USD/CHF، يوم الأربعاء، 9 يوليو 2025؟

USD/CHF – الأربعاء، 9 يوليو 2025. بسبب دعم الدولار الأمريكي كملاذ آمن ومخاطر التجارة العالمية، على الرغم من أن الفرنك السويسري قوي إلى حد ما، إلا أن هذه الظروف

Arief Makmur 07:12 2025-07-09 UTC+2

يواصل البائعون السيطرة على زوج العملات السلعية NZD/USD، يوم الأربعاء، 9 يوليو 2025.

NZD/USD، الأربعاء، 9 يوليو 2025. المشاعر العالمية تجاه العملات السلعية وتوقعات السياسة النقدية الحذرة لنيوزيلندا تضغط على إمكانيات الكيوي اليوم. المستويات الرئيسية 1. المقاومة 2: 0.6054. 2. المقاومة 1: 0.6022

Arief Makmur 07:12 2025-07-09 UTC+2

توقعات EUR/USD ليوم 9 يوليو 2025

يوم الثلاثاء، حاول اليورو التحرك نحو الانخفاض لكنه فشل في الوصول إلى الدعم عند خط MACD، وتوقف عند مستوى الهدف 1.1692. وأغلق اليوم بشمعة بيضاء، مما زاد من احتمالية ارتداد

Laurie Bailey 06:58 2025-07-09 UTC+2

توقعات GBP/USD ليوم 9 يوليو 2025

اختبر الجنيه الإسترليني أمس المنطقة المحيطة بخط التوازن اليومي. كشفت هذه الحركة عن ضعف مستويات الدعم في الطريق نحو مستوى الهدف 1.3414، وهو ما يؤكده مؤشر مارلين الذي ينخفض بثبات

Laurie Bailey 06:30 2025-07-09 UTC+2

توقعات USD/JPY ليوم 9 يوليو 2025

USD/JPY يبدو أن زوج USD/JPY يقترب من إكمال تشكيل مثلث. هناك عدة سيناريوهات محتملة. وفقًا للسيناريو الرئيسي، من المرجح أن يختبر الزوج الحد العلوي للمثلث عند 147.75، يليه اختراق هبوطي

Laurie Bailey 06:25 2025-07-09 UTC+2

إشارات التداول لليورو/الدولار الأمريكي للفترة من 8 إلى 12 يوليو 2025: الشراء فوق 1.1650 (21 SMA - 8/8 Murray)

وصل مؤشر النسر إلى مستويات البيع المفرط، لذلك نعتقد أن اليورو قد يتعافى فوق 1.1680 في الساعات القادمة ثم يصل إلى 1.1718، حيث يقع مستوى 8/8 Murray، وربما

Dimitrios Zappas 18:58 2025-07-08 UTC+2

إشارات التداول للذهب (XAU/USD) للفترة من 8 إلى 12 يوليو 2025: الشراء فوق $3,285 (21 SMA - 4/8 Murray)

إذا حدث كسر دون مستوى 3,281، يمكننا توقع تسارع هبوطي، وقد يصل الذهب إلى مستوى 3/8 Murray عند 3,242 وفي النهاية يصل إلى قاع القناة الرئيسية للاتجاه الهابط حول المستوى

Dimitrios Zappas 18:56 2025-07-08 UTC+2
لا تستطيع التحدث الآن؟
اطرح سؤالك في الدردشة.
Widget callback
 

Dear visitor,

Your IP address shows that you are currently located in the USA. If you are a resident of the United States, you are prohibited from using the services of InstaFintech Group including online trading, online transfers, deposit/withdrawal of funds, etc.

If you think you are seeing this message by mistake and your location is not the US, kindly proceed to the website. Otherwise, you must leave the website in order to comply with government restrictions.

Why does your IP address show your location as the USA?

  • - you are using a VPN provided by a hosting company based in the United States;
  • - your IP does not have proper WHOIS records;
  • - an error occurred in the WHOIS geolocation database.

Please confirm whether you are a US resident or not by clicking the relevant button below. If you choose the wrong option, being a US resident, you will not be able to open an account with InstaForex anyway.

We are sorry for any inconvenience caused by this message.