empty
21.03.2023 03:41 PM
Trading Signal for GOLD (XAU/USD) for March 21 - 22, 2023: sell below $1,968 or buy if rebound $1,960 (7/8 Murray - 21 SMA )

This image is no longer relevant

XAU/USD retreats from its annual high reached on March 20 at 2,009.66. The global banking jitters have passed for now and US Treasury yields have been bouncing, erasing Gold's strength.

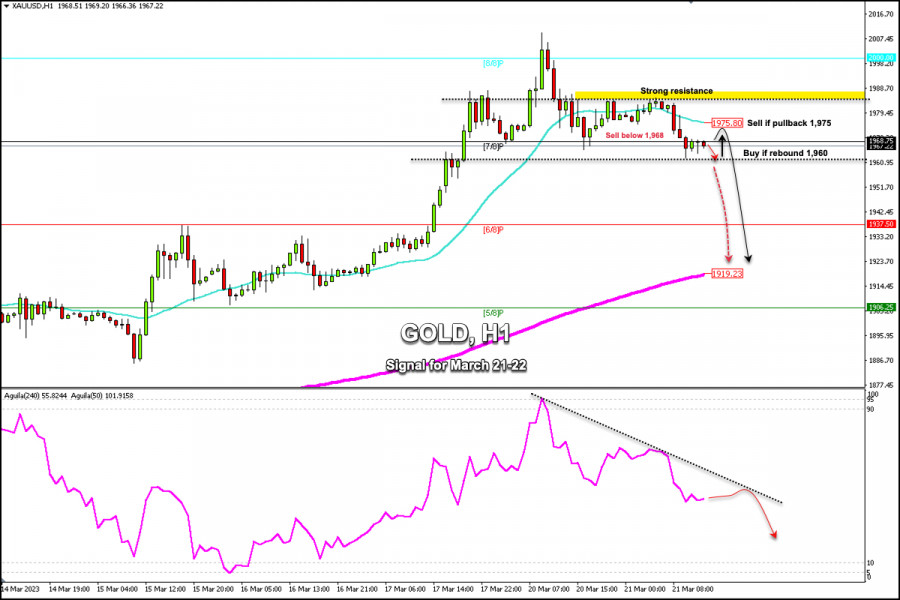
According to the 1-hour chart, gold is trading below the 21 SMA located at 1,975 and below the strong resistance of 1,986. We can clearly see that the asset is under strong bearish pressure but it could find a bottom around 1,960. At this level in the 4-hour chart, we can see the 21 SMA which will act as strong support and gold could then resume the bullish cycle.

In case gold breaks out sharply and consolidates below 1,960, we would expect a bearish acceleration and the instrument could reach the 6/8 Murray at 1,937 and could ultimately reach the 200 EMA located at 1,919.

On the contrary, if gold remains above 1,960, it could give us a signal to buy with targets at 1,975 (21 SMA) and 1,986 (weekly_resistance).

Since its high reached in the last hours, gold has made a correction of almost $40 as part of profit taking. The instrument is likely to see a technical rebound in the coming hours and then continue with a short-term downtrend.

Our trading plan for the next few hours is to sell below 7/8 Murray located at 1,968, with targets at 1,960. Around this level, we can expect a technical bounce to buy with targets at 1,975. The Eagle indicator from 20 March is giving a negative signal. Hence, as long as the metal trades below 1,985, any technical bounce will be seen as a signal to sell.

Dimitrios Zappas,
الخبير التحليلي لدى شركة إنستافوركس
© 2007-2025
حدد الإطار الزمني
5
د
15
د
30
د
1
س
4
ساعات
1
يوم
1
أسبوع
كسب عائد من تغيرات أسعار العملات المشفرة مع إنستافوركس.
قم بتحميل منصة التداول ميتاتريدر 4 وافتح أول صفقة.
  • Grand Choice
    Contest by
    InstaForex
    InstaForex always strives to help you
    fulfill your biggest dreams.
    انضم إلى المسابقة

المقالات الموصى بها

اليورو/الدولار الأمريكي. 3 يوليو. اليوم الأهم في الأسبوع

يوم الأربعاء، ارتد زوج اليورو/الدولار الأمريكي من مستوى 1.1802، وانعكس لصالح الدولار الأمريكي، وأظهر انخفاضًا طفيفًا. ومع ذلك، بحلول صباح الخميس، كان الزوج قد عاد إلى مستوى 1.1802. إن حدوث

Samir Klishi 12:10 2025-07-03 UTC+2

GBP/USD. قد يتوقف الجنيه الإسترليني عن تلقي الدعم

كما ذُكر سابقًا في مناسبات متعددة، فإن قوة العملات الرئيسية المتداولة مقابل الدولار الأمريكي في سوق الصرف الأجنبي (الفوركس) كانت تعتمد بشكل أساسي على الضعف الأساسي للعملة الأمريكية بسبب حالة

Pati Gani 11:27 2025-07-03 UTC+2

توقعات الفوركس 03/07/2025: اليورو/الدولار الأمريكي، الدولار الأمريكي/الين الياباني، الجنيه الإسترليني/الدولار الأمريكي، SP500، الذهب والبيتكوين

روابط مفيدة: مقالاتي الأخرى متوفرة في هذا القسم دورة InstaForex للمبتدئين التحليلات الشائعة افتح حساب تداول مهم: يجب على المبتدئين في تداول الفوركس أن يكونوا حذرين للغاية عند اتخاذ قرارات

Sebastian Seliga 10:57 2025-07-03 UTC+2

التوقعات لزوج الجنيه الإسترليني/الدولار الأمريكي في 3 يوليو 2025

على الرسم البياني الساعي، ارتد زوج الجنيه الإسترليني/الدولار الأمريكي يوم الأربعاء من مستوى تصحيح 200.0% عند 1.3749، وانعكس لصالح الدولار الأمريكي، وانخفض إلى ما دون منطقة الدعم 1.3611–1.3633. لا يبدو

Samir Klishi 10:03 2025-07-03 UTC+2

إذا تمكن النفط الخام من كسر مستوى المحور، فإنه لديه القدرة على اختبار مستوى الدعم الأقرب له، يوم الخميس، 3 يوليو 2025.

النفط الخام، الخميس، 3 يوليو 2025. الأوضاع الاقتصادية العالمية السيئة مثل ركود التصنيع في الصين وأوروبا أثارت مخاوف بشأن الطلب العالمي على النفط الخام وتوقعات بزيادات محتملة في إنتاج النفط

Arief Makmur 07:36 2025-07-03 UTC+2

لدى مؤشر ناسداك 100 القدرة على اختبار مستوى المقاومة الأقرب له، يوم الخميس، 3 يوليو 2025.

مؤشر ناسداك 100، الخميس، 3 يوليو 2025. التقارير المالية الإيجابية لشركات التكنولوجيا الكبرى والشائعات المتزايدة حول سياسة الاحتياطي الفيدرالي المتساهلة وارتفاع الابتكار في الذكاء الاصطناعي قد خلقت شعورًا إيجابيًا

Arief Makmur 07:36 2025-07-03 UTC+2

توقعات EUR/AUD ليوم 3 يوليو 2025

على الرسم البياني اليومي، يتحرك زوج اليورو/الدولار الأسترالي بشكل جانبي في النصف العلوي من قناة السعر وفوق خط مؤشر MACD. خط الإشارة لمذبذب Marlin يتراجع قليلاً ضمن المنطقة الإيجابية،

Laurie Bailey 06:33 2025-07-03 UTC+2

توقعات EUR/USD ليوم 3 يوليو 2025

قبل صدور بيانات التوظيف الأمريكية لشهر يونيو اليوم، استقر اليورو بالقرب من خط قناة السعر على الرسم البياني اليومي. الظل السفلي الطويل للشمعة يشير إلى أن المشاركين في السوق كانوا

Laurie Bailey 05:11 2025-07-03 UTC+2

توقعات GBP/USD ليوم 3 يوليو 2025

بحلول نهاية يوم أمس، فقد الجنيه الإسترليني 108 نقاط. وعلى الرغم من أن السبب لم يكن الترقب لبيانات التوظيف الأمريكية اليوم، بل الاضطرابات السياسية الداخلية، إلا أن هذا قد يؤدي

Laurie Bailey 05:11 2025-07-03 UTC+2

توقعات الفضة ليوم 3 يوليو 2025

بعد يومين من الصراع الشديد (الاثنين والثلاثاء) بين الثيران والدببة على طول خط قناة السعر وسط تقلبات متزايدة، شهدنا أمس النتيجة — حيث فاز الثيران، مما دفع سعر الفضة للارتفاع

Laurie Bailey 05:11 2025-07-03 UTC+2
لا تستطيع التحدث الآن؟
اطرح سؤالك في الدردشة.
Widget callback
 

Dear visitor,

Your IP address shows that you are currently located in the USA. If you are a resident of the United States, you are prohibited from using the services of InstaFintech Group including online trading, online transfers, deposit/withdrawal of funds, etc.

If you think you are seeing this message by mistake and your location is not the US, kindly proceed to the website. Otherwise, you must leave the website in order to comply with government restrictions.

Why does your IP address show your location as the USA?

  • - you are using a VPN provided by a hosting company based in the United States;
  • - your IP does not have proper WHOIS records;
  • - an error occurred in the WHOIS geolocation database.

Please confirm whether you are a US resident or not by clicking the relevant button below. If you choose the wrong option, being a US resident, you will not be able to open an account with InstaForex anyway.

We are sorry for any inconvenience caused by this message.