empty
20.01.2023 07:10 PM
Technical analysis of EUR/USD for January 20, 2023

This image is no longer relevant

Overview :

The expected trend for today: Bullish.

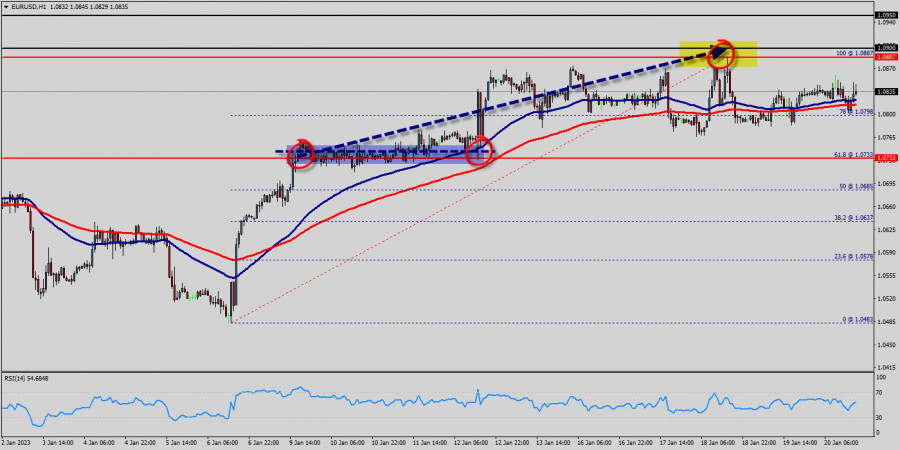
The EUR/USD pair rallied upwards strongly yesterday to breach the bearish channel's resistance and settles above it, opening the way to turn to the upside on the intraday and short-term basis, starting bullish correction for the raise measured from 1.0733 to 1.0835, noting that the first main station is located at 1.0887, which breaching it represents the key to achieve additional gains that reach 1.0900.

Therefore, the bullish bias will be suggested for today, supported by the EMA100 that carries the price from above, taking into consideration that breaking 1.0835 will stop the expected rise and push the price back to the main bearish track again.

A medium term topped could be in place already, on bullish convergence condition in daily RSI.

Intraday bias is now on the upside for 61.8% retracement of 1.0733 to 1.0835 at 1.0887. The EUR/USD pair traded higher and closed the day in the positive territory around 1.0835-1.0887.

On the hourly chart, EUR/USD is still trading above the moving average line MA (100) H1 (1.0835).

Accordingly, the bullish outlook remains the same as long as the EMA 100 is pointing to the uptrend. This suggests that the pair will probably go above the daily pivot point (1.0835) in the coming hours.

The EUR/USD pair will demonstrate strength following a breakout of the high at 1.0835 . The situation is similar on the four-hour chart. Based on the foregoing, it is probably worth sticking to the north direction in trading, and as long as the EUR/USD pair remains above MA100 H1, it may be necessary to look for entry points to buy for the formation of a correction. Probably, the main scenario is continued growth towards 1.0887 (Oct. 26 high). The expected trading range for today is between 1.0733 support and 1.0900 resistance.

Forecast:

Uptrend scenario :

An uptrend will start as soon, as the market rises above resistance level 1.0733, which will be followed by moving up to resistance level 1.0887. Further close above the high end may cause a rally towards 1.0887and 1.0900. Nonetheless, the weekly resistance level and zone should be considered at 1.0900.

Alternative scenario :

On the downside, break of 1.0733 major

support will turn intraday bias neutral first. The breakdown of 1.0733 will allow the pair to down further down to the prices of 1.0700 and 1.0685.

Mourad El Keddani,
الخبير التحليلي لدى شركة إنستافوركس
© 2007-2025
Summary
Urgency
Analytic
Mourad El Keddani
Start trade
كسب عائد من تغيرات أسعار العملات المشفرة مع إنستافوركس.
قم بتحميل منصة التداول ميتاتريدر 4 وافتح أول صفقة.
  • Grand Choice
    Contest by
    InstaForex
    InstaForex always strives to help you
    fulfill your biggest dreams.
    انضم إلى المسابقة

المقالات الموصى بها

AUD/JPY. التحليل والتوقعات

زوج العملات AUD/JPY يواجه صعوبة في جذب اهتمام الشراء، حيث يتداول بالقرب من المستوى النفسي 95.00 وقريبًا من أدنى مستوى له في نحو أربعة أسابيع الذي تم الوصول إليه

Irina Yanina 11:38 2025-08-05 UTC+2

التوقعات لليورو/الدولار الأمريكي في 5 أغسطس 2025

يوم الاثنين، تحرك زوج اليورو/الدولار الأمريكي بشكل جانبي فوق مستوى تصحيح فيبوناتشي 100.0% عند 1.1558. لذلك، قد يستأنف الحركة الصعودية في أي لحظة نحو المستويات 1.1612 و1.1645. أما التماسك

Samir Klishi 11:32 2025-08-05 UTC+2

التوقعات لزوج الجنيه الإسترليني/الدولار الأمريكي في 5 أغسطس 2025

في الرسم البياني لكل ساعة، تحرك زوج الجنيه الإسترليني/الدولار الأمريكي بشكل جانبي فوق مستوى التصحيح 127.2% - 1.3258 - يوم الاثنين. ونتيجة لذلك، قد يستمر الاتجاه الصعودي يوم الثلاثاء

Samir Klishi 11:27 2025-08-05 UTC+2

توقعات الفوركس 05/08/2025: اليورو/الدولار الأمريكي، الدولار الأمريكي/الين الياباني، الجنيه الإسترليني/الدولار الأمريكي، إيثريوم وبيتكوين

روابط مفيدة: مقالاتي الأخرى متوفرة في هذا القسم دورة InstaForex للمبتدئين التحليلات الشائعة افتح حساب تداول مهم: يجب على المبتدئين في تداول الفوركس أن يكونوا حذرين للغاية عند اتخاذ قرارات

Sebastian Seliga 11:23 2025-08-05 UTC+2

GBP/USD. تحليل المؤشرات ونظرة يومية ليوم 5 أغسطس 2025

يوم الاثنين، تحرك الزوج صعودًا ووصل إلى مستوى تصحيح 38.2% عند 1.3338 (الخط الأحمر المتقطع)، ثم انخفض وأغلق شمعة اليوم عند 1.3280. اليوم، قد يحاول الاستمرار في التحرك نحو الأسفل،

Stefan Doll 10:37 2025-08-05 UTC+2

اليورو/الدولار الأمريكي. تحليل المؤشرات ونظرة يومية ليوم 5 أغسطس 2025

يوم الاثنين، تحرك الزوج نحو الأسفل، واخترق مستوى التصحيح 38.2% عند 1.1549 (الخط الأصفر المتقطع)، وأغلق شمعة اليوم عند 1.1570. اليوم، قد يستمر الاتجاه الهابط، مع توقع أخبار هامة

Stefan Doll 10:31 2025-08-05 UTC+2

إذا تمكن مستوى المقاومة 1.3793 من الصمود أمام هذا التعزيز المحدود، فإن USD/CAD سيضعف مرة أخرى. الثلاثاء، 5 أغسطس 2025.

USD/CAD – الثلاثاء، 5 أغسطس 2025. على الرغم من أن مؤشر RSI(14) في وضع محايد-صعودي، ومع تشكيل EMA لتقاطع الموت، يبدو أن الربط في لندن لا يزال لديه القدرة

Arief Makmur 07:05 2025-08-05 UTC+2

يبدو أن الجنيه الإسترليني يواصل تعزيز قوته نحو مستوى المقاومة الأقرب. الثلاثاء، 5 أغسطس 2025.

GBP/USD – الثلاثاء، 5 أغسطس 2025. على الرغم من أن مؤشر RSI(14) يقع عند مستوى محايد-هبوطي، إلا أن تقاطع الذهب للـ EMA يشير إلى أن المشترين لا يزالون مهيمنين بشكل

Arief Makmur 07:05 2025-08-05 UTC+2

توقعات زوج اليورو/الدولار الأمريكي ليوم 5 أغسطس 2025

كان نطاق تداول اليورو يوم الاثنين 47 نقطة، وأغلق اليوم بشمعة سوداء (هابطة). فشل السعر في تحقيق اختراق قوي فوق خط مؤشر التوازن. كما كان متوقعًا، توقفت السوق عن الحركة

Laurie Bailey 05:12 2025-08-05 UTC+2

توقعات GBP/USD ليوم 5 أغسطس 2025

يوم الاثنين، بقي الجنيه الإسترليني ضمن نطاق التوحيد من النصف الأول من مايو، بين 1.3253 و1.3364 (تم تعديل حدود النطاق قليلاً). على الرسم البياني اليومي، يشير مذبذب مارلين إلى الأعلى،

Laurie Bailey 05:05 2025-08-05 UTC+2
لا تستطيع التحدث الآن؟
اطرح سؤالك في الدردشة.
Widget callback
 

Dear visitor,

Your IP address shows that you are currently located in the USA. If you are a resident of the United States, you are prohibited from using the services of InstaFintech Group including online trading, online transfers, deposit/withdrawal of funds, etc.

If you think you are seeing this message by mistake and your location is not the US, kindly proceed to the website. Otherwise, you must leave the website in order to comply with government restrictions.

Why does your IP address show your location as the USA?

  • - you are using a VPN provided by a hosting company based in the United States;
  • - your IP does not have proper WHOIS records;
  • - an error occurred in the WHOIS geolocation database.

Please confirm whether you are a US resident or not by clicking the relevant button below. If you choose the wrong option, being a US resident, you will not be able to open an account with InstaForex anyway.

We are sorry for any inconvenience caused by this message.