empty
12.11.2021 11:16 AM
EUR/USD, USD/JPY, GBP/JPY, GOLD simplified wave analysis and forecast on November 12

EUR/USD

Analysis:

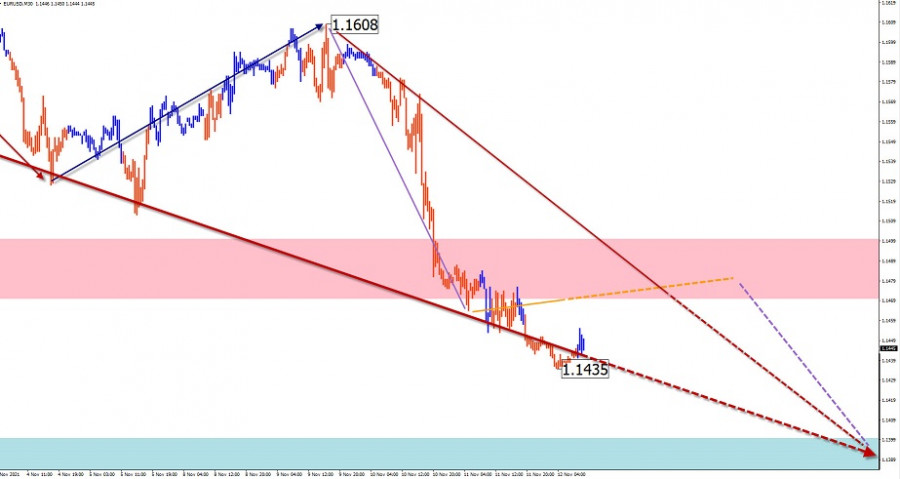
The main direction of the intraday movement of the euro continues to be set by the descending wave from January 6. All counter-movements are within intermediate-term corrections. After breaking through another support, a new section on the main course has started.

Forecast:

A generally flat trading pattern is likely in the coming trading sessions. Short-term price rises are also possible, not beyond the resistance zone. A return to a downtrend is expected at the end of the day or tomorrow.

Potential reversal zones

Resistance:

- 1.1470/1.1500

Support:

- 1.1400/1.1370

Recommendations:

There are no conditions for buying on the euro market today. It is advisable to refrain from entering the market until the completion of the price pullback, with the search for signals to sell the instruments around the calculated resistance.

This image is no longer relevant

USD/JPY

Analysis:

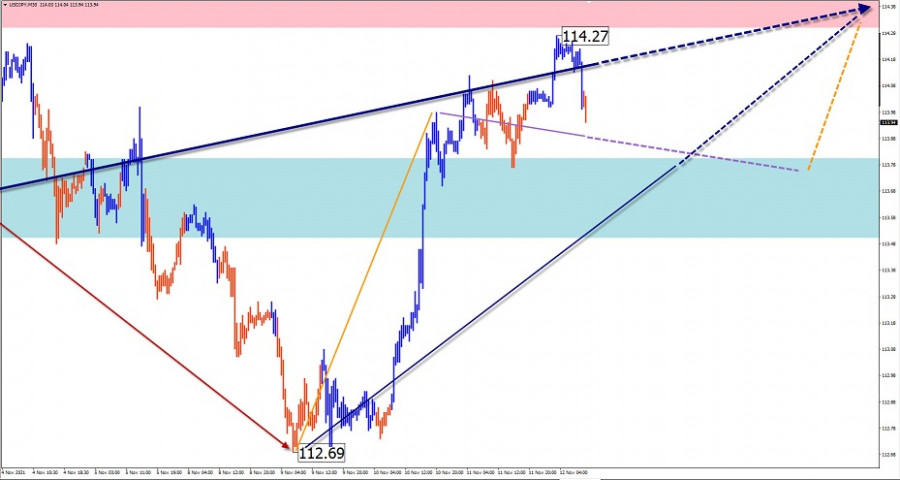
A month-and-a-half-long bearish correction has ended on the Japanese yen major chart. The last leg of the uptrend started on November 9. The price is approaching the lower edge of the wide resistance zone of the upper TF.

Forecast:

In the coming day, the price is expected to move in a narrow range between the opposing zones. After an attempted pressure on the support zone, a change of vector and an upward price move is expected.

Potential reversal zones

Resistance:

- 114.30/114.60

Support:

- 113.80/113.50

Recommendations:

Trading in the Japanese yen market today can be risky. Short-term trades in fractional lots inside the price channel are possible.

This image is no longer relevant

GBP/JPY

Analysis:

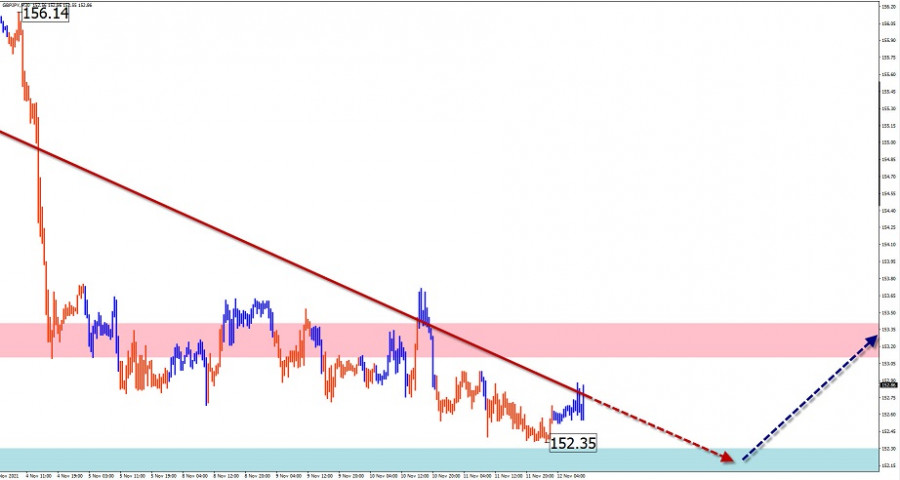
The pound/yen cross continues to move north on the price chart. The price has been forming an intermediate correction from the lower boundary of the strong resistance since October 20. By now the pair has reached a support level.

Forecast:

The general sideways price movement is expected to continue over the next 24 hours. In the second half of the day, after likely pressure on the support zone, a return to an upward vector can be expected, with prices rising towards the resistance zone.

Potential reversal zones

Resistance:

- 153.10/153.40

Support:

- 152.30/152.00

Recommendations:

Trading in this cross pair in the next 24 hours will only be possible in intraday trading with a reduced lot. Buying is more promising today.

This image is no longer relevant

GOLD

Analysis:

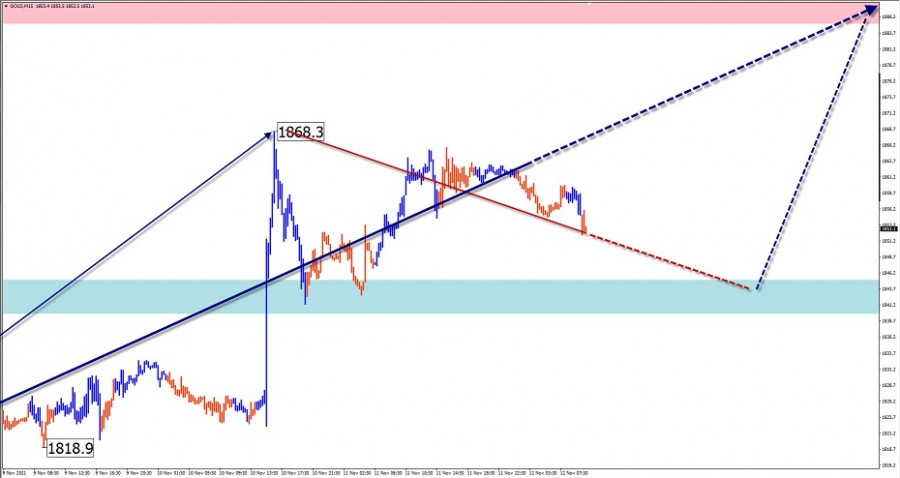
On the gold market, an upward wave has been forming since the end of February. The incomplete portion of the wave dates back to September 30. The gold price is approaching the lower boundary of the potential reversal zone of the senior TF.

Forecast:

Today, the general upward movement is expected to continue. Short-term declines are possible in the European session, but not beyond the support zone. The highest activity is likely by the end of the day.

Potential reversal zones

Resistance:

- 1885.0/1890.0

Support:

- 1845.0/1840.0

Recommendations:

There are no conditions for selling on the gold market today. It is recommended to refrain from entering the instrument until there are clear buying signals around settlement support.

This image is no longer relevant

Explanation: In simplified wave analysis (SVA), waves consist of 3 parts (A-B-C). The last unfinished wave is analysed. The solid arrow background shows the structure formed. The dotted arrow shows the expected movements.

Attention: The wave algorithm does not take into account the duration of the instrument movements over time!

Isabel Clark,
الخبير التحليلي لدى شركة إنستافوركس
© 2007-2025
حدد الإطار الزمني
5
د
15
د
30
د
1
س
4
ساعات
1
يوم
1
أسبوع
كسب عائد من تغيرات أسعار العملات المشفرة مع إنستافوركس.
قم بتحميل منصة التداول ميتاتريدر 4 وافتح أول صفقة.
  • Grand Choice
    Contest by
    InstaForex
    InstaForex always strives to help you
    fulfill your biggest dreams.
    انضم إلى المسابقة

المقالات الموصى بها

تحليل GBP/USD في 26 يونيو 2025

يستمر نمط الموجة لزوج الجنيه الإسترليني/الدولار الأمريكي في الإشارة إلى تطور هيكل موجة دافعة صاعدة. يتشابه تخطيط الموجة بشكل كبير مع زوج اليورو/الدولار الأمريكي، حيث يبقى السبب الوحيد للارتفاع

Chin Zhao 19:27 2025-06-26 UTC+2

تحليل EUR/USD في 26 يونيو 2025

نمط الموجة على الرسم البياني لمدة 4 ساعات لزوج اليورو/الدولار الأمريكي يستمر في الإشارة إلى تشكيل جزء من الاتجاه الصاعد. حتى 28 فبراير، عندما بدأ انخفاض الدولار الأمريكي، كانت هيكلية

Chin Zhao 19:20 2025-06-26 UTC+2

تحليل يورو/دولار أمريكي في 25 يونيو 2025

نمط الموجة على الرسم البياني لمدة 4 ساعات لزوج اليورو/الدولار الأمريكي يستمر في الإشارة إلى تشكيل جزء من الاتجاه الصعودي. حتى 28 فبراير، عندما بدأ الدولار الأمريكي في الانخفاض،

Chin Zhao 19:10 2025-06-25 UTC+2

تحليل GBP/USD في 24 يونيو 2025

نمط الموجة لزوج الجنيه الإسترليني/الدولار الأمريكي يستمر في الإشارة إلى تشكيل تسلسل موجة دافعة صاعدة. نمط الموجة يكاد يكون مطابقًا لنمط زوج اليورو/الدولار الأمريكي، حيث يظل المحرك الرئيسي

Chin Zhao 19:35 2025-06-24 UTC+2

تحليل EUR/USD في 24 يونيو 2025

يستمر نمط الموجة على الرسم البياني لليورو/الدولار الأمريكي لمدة 4 ساعات في الإشارة إلى تشكيل جزء من الاتجاه الصاعد. حدث هذا التحول فقط بسبب السياسة التجارية الجديدة للولايات المتحدة

Chin Zhao 19:29 2025-06-24 UTC+2

تحليل EUR/USD في 23 يونيو 2025

يستمر نمط الموجة في الرسم البياني لليورو/الدولار الأمريكي لمدة 4 ساعات في الإشارة إلى تطور جزء من الاتجاه الصاعد. حدث هذا التحول بشكل حصري بسبب السياسة التجارية الجديدة للولايات المتحدة

Chin Zhao 19:08 2025-06-23 UTC+2

التوقعات الأسبوعية بناءً على تحليل الموجات المبسط لزوج العملات الجنيه الإسترليني/الدولار الأمريكي، الدولار الأسترالي/الدولار الأمريكي، الدولار الأمريكي/الفرنك السويسري، اليورو/الين الياباني، اليورو/الجنيه الإسترليني، ومؤشر الدولار الأمريكي — 23 يونيو

في الأيام القادمة، من المحتمل أن يحدث تراجع هبوطي في أسعار الجنيه الإسترليني، قد يصل إلى منطقة الدعم المحسوبة. بعد الوصول إلى هذا المستوى، من المرجح أن تتحرك الأسعار بشكل

Isabel Clark 11:14 2025-06-23 UTC+2

التوقعات الأسبوعية بناءً على تحليل الموجات المبسط لزوج اليورو/الدولار الأمريكي، الدولار الأمريكي/الين الياباني، الجنيه الإسترليني/الين الياباني، الدولار الأمريكي/الدولار الكندي، الدولار النيوزيلندي/الدولار الأمريكي، والذهب — 23 يونيو

التوقعات للأيام القادمة: من المتوقع أن يستمر التحرك الجانبي. بالقرب من منطقة الدعم المتوقعة، هناك احتمال كبير لحدوث توقف وتشكيل ظروف للانعكاس. من المرجح أن يحدث تحرك صعودي في الأسعار

Isabel Clark 11:09 2025-06-23 UTC+2

تحليل GBP/USD في 17 يونيو 2025

يستمر نمط الموجة على مخطط GBP/USD في الإشارة إلى تشكيل نمط موجة دافعة صاعدة. يتشابه تخطيط الموجة بشكل كبير مع EUR/USD، حيث أن المحرك الرئيسي هنا هو الدولار الأمريكي. الطلب

Chin Zhao 21:24 2025-06-17 UTC+2

تحليل EUR/USD في 17 يونيو 2025

نمط الموجة على الرسم البياني لليورو/الدولار الأمريكي لمدة 4 ساعات يستمر في الإشارة إلى تطور جزء من الاتجاه الصاعد. حدث هذا التحول فقط بسبب السياسة التجارية الجديدة للولايات المتحدة

Chin Zhao 21:18 2025-06-17 UTC+2
لا تستطيع التحدث الآن؟
اطرح سؤالك في الدردشة.
Widget callback
 

Dear visitor,

Your IP address shows that you are currently located in the USA. If you are a resident of the United States, you are prohibited from using the services of InstaFintech Group including online trading, online transfers, deposit/withdrawal of funds, etc.

If you think you are seeing this message by mistake and your location is not the US, kindly proceed to the website. Otherwise, you must leave the website in order to comply with government restrictions.

Why does your IP address show your location as the USA?

  • - you are using a VPN provided by a hosting company based in the United States;
  • - your IP does not have proper WHOIS records;
  • - an error occurred in the WHOIS geolocation database.

Please confirm whether you are a US resident or not by clicking the relevant button below. If you choose the wrong option, being a US resident, you will not be able to open an account with InstaForex anyway.

We are sorry for any inconvenience caused by this message.